

Fibonacci tools in technical analysis use mathematical ratios to mark potential support and resistance zones on a price chart. They're based on the Fibonacci sequence, in which each number is the sum of the two before it, but they can't predict the path of a cryptocurrency with certainty.
So how did we get from a sequence of numbers to the lines you see on Bitcoin charts? We think Fibonacci is interesting as a tool for organizing your analysis. The problem starts when we ask it to work like a crystal ball.
What is the Fibonacci sequence
The Fibonacci sequence usually starts at 0 and 1 and continues like this: 0, 1, 1, 2, 3, 5, 8, 13, 21, 34, 55, 89, 144… The rule never changes: add the two previous numbers to get the next one.
For example, 8 comes from 3 + 5, 13 from 5 + 8 and 21 from 8 + 13. In mathematical notation the rule is written as F(n) = F(n−1) + F(n−2), with starting values F(0) = 0 and F(1) = 1.
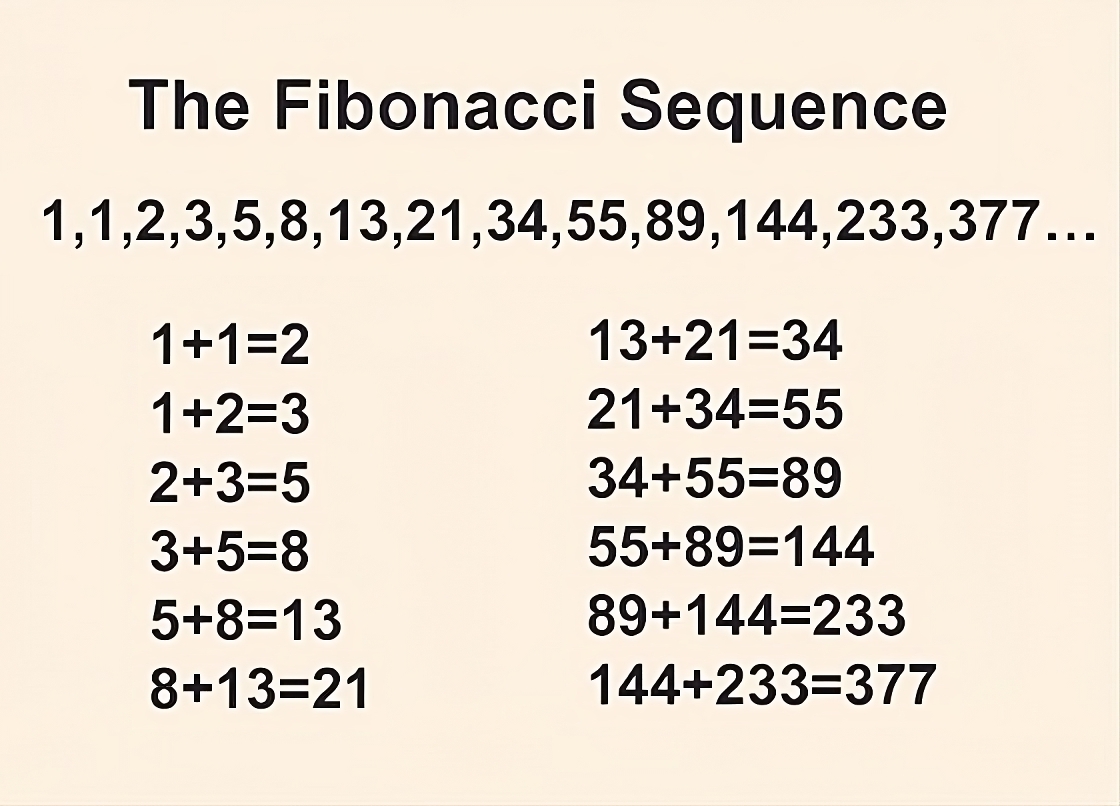
You'll often see it called the “Fibonacci series.” The more accurate term here is sequence, because we're talking about successive numbers, not their sum. Some presentations start it at 1, 1, which doesn't change the rule.
Who was Fibonacci
Fibonacci, also known as Leonardo of Pisa, was an Italian mathematician of the Middle Ages. His work helped spread the Hindu-Arabic numerals and the decimal place-value system in Europe, at a time when calculations were often done in far more cumbersome ways.
The sequence became linked to his name through a math problem about breeding rabbits. It wasn't, however, created by a stock market analyst, nor was it designed to predict prices. Similar numerical relationships had been studied even earlier in the Indian mathematical tradition.
The golden ratio and Fibonacci ratios
If you divide a number in the sequence by the one before it, the ratio gradually approaches 1.618…, the golden ratio. For example, 89 / 55 gives roughly 1.618. If you flip the division, the result approaches 0.618, or 61.8%.
Related divisions give other ratios too. Dividing a number by the one two places after it approaches 38.2%, while dividing by the one three places after it approaches 23.6%.
Fibonacci numbers show up in some plant growth patterns, such as the arrangement of seeds or leaves. That doesn't mean every seashell follows the golden ratio or that planetary orbits are described by the sequence. And above all, the presence of a pattern in nature doesn't prove that a market must follow it.
How Fibonacci works in crypto
The most common application is Fibonacci retracement levels. The analyst picks a completed move between a low and a high, and the tool splits its range into percentage levels.
Think of a tape measure that shows how much of the previous rally the price has given back. The tape measures the distance; on its own, it doesn't explain why the market is moving or where it will stop.
In an upward move, the levels are used to examine potential support zones during the pullback. In a downward move, they're used for potential resistance zones during the rebound. Support is an area where buying interest may appear, and resistance an area where selling may pick up.
Which levels are used
Charting tools usually show 23.6%, 38.2%, 50%, 61.8% and 78.6%, along with the endpoints 0% and 100%. The 78.6% level comes roughly from the square root of 0.618.
The 50% level is not a ratio derived from the Fibonacci sequence in the same way. It's included by convention, because a retracement to the halfway point of a move is widely used in technical analysis. The 0% and 100% levels set the boundaries of the measurement.
How to draw it on the chart
- Pick the timeframe and a distinct move with a clear start and end.
- For an upward move, mark the low and then the high. For a downward move, mark the high and then the low.
- Check which way the percentages run, because the tool's settings can change how they're displayed.
- Read the levels as areas to watch, not as automatic trading signals.
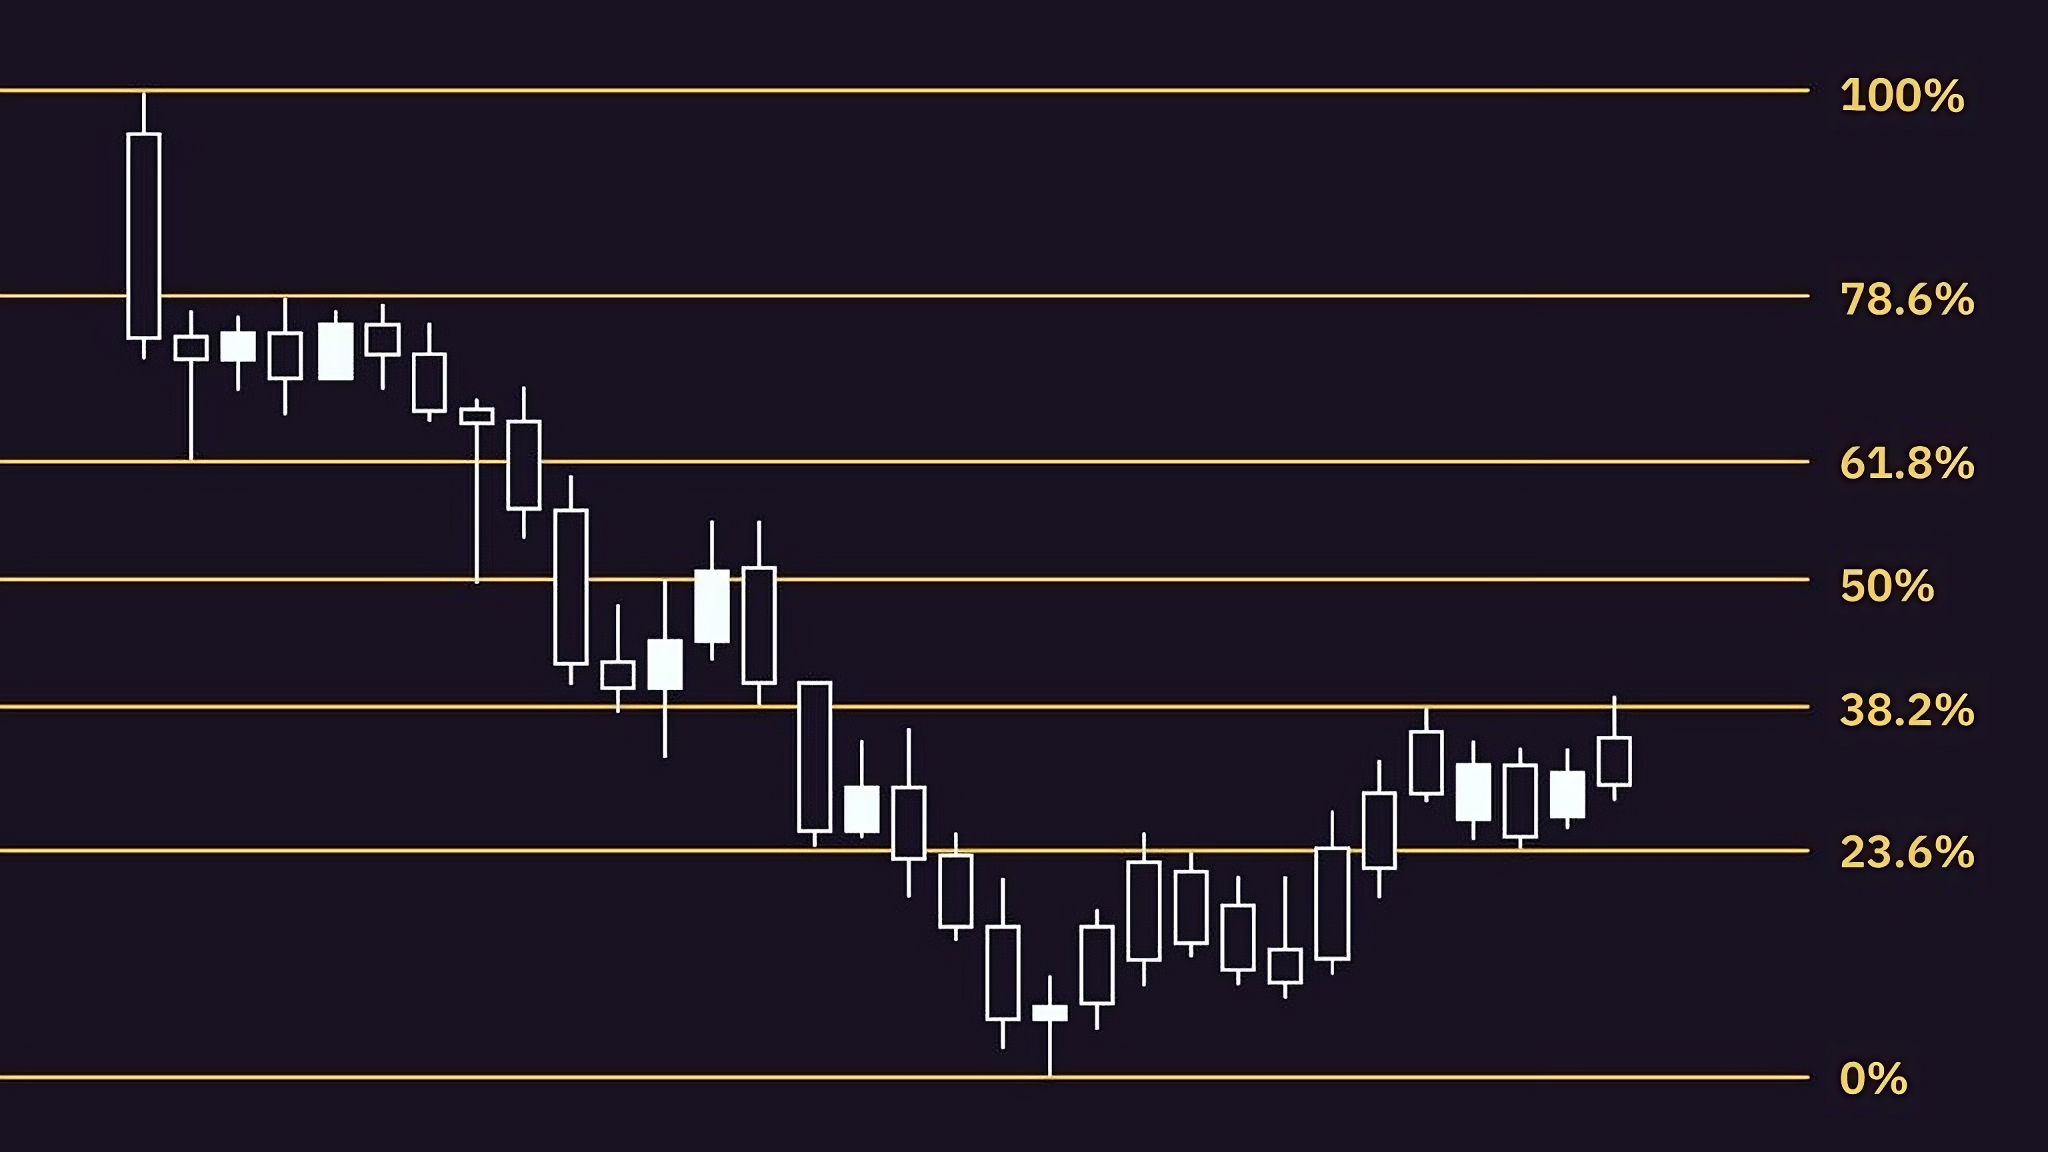
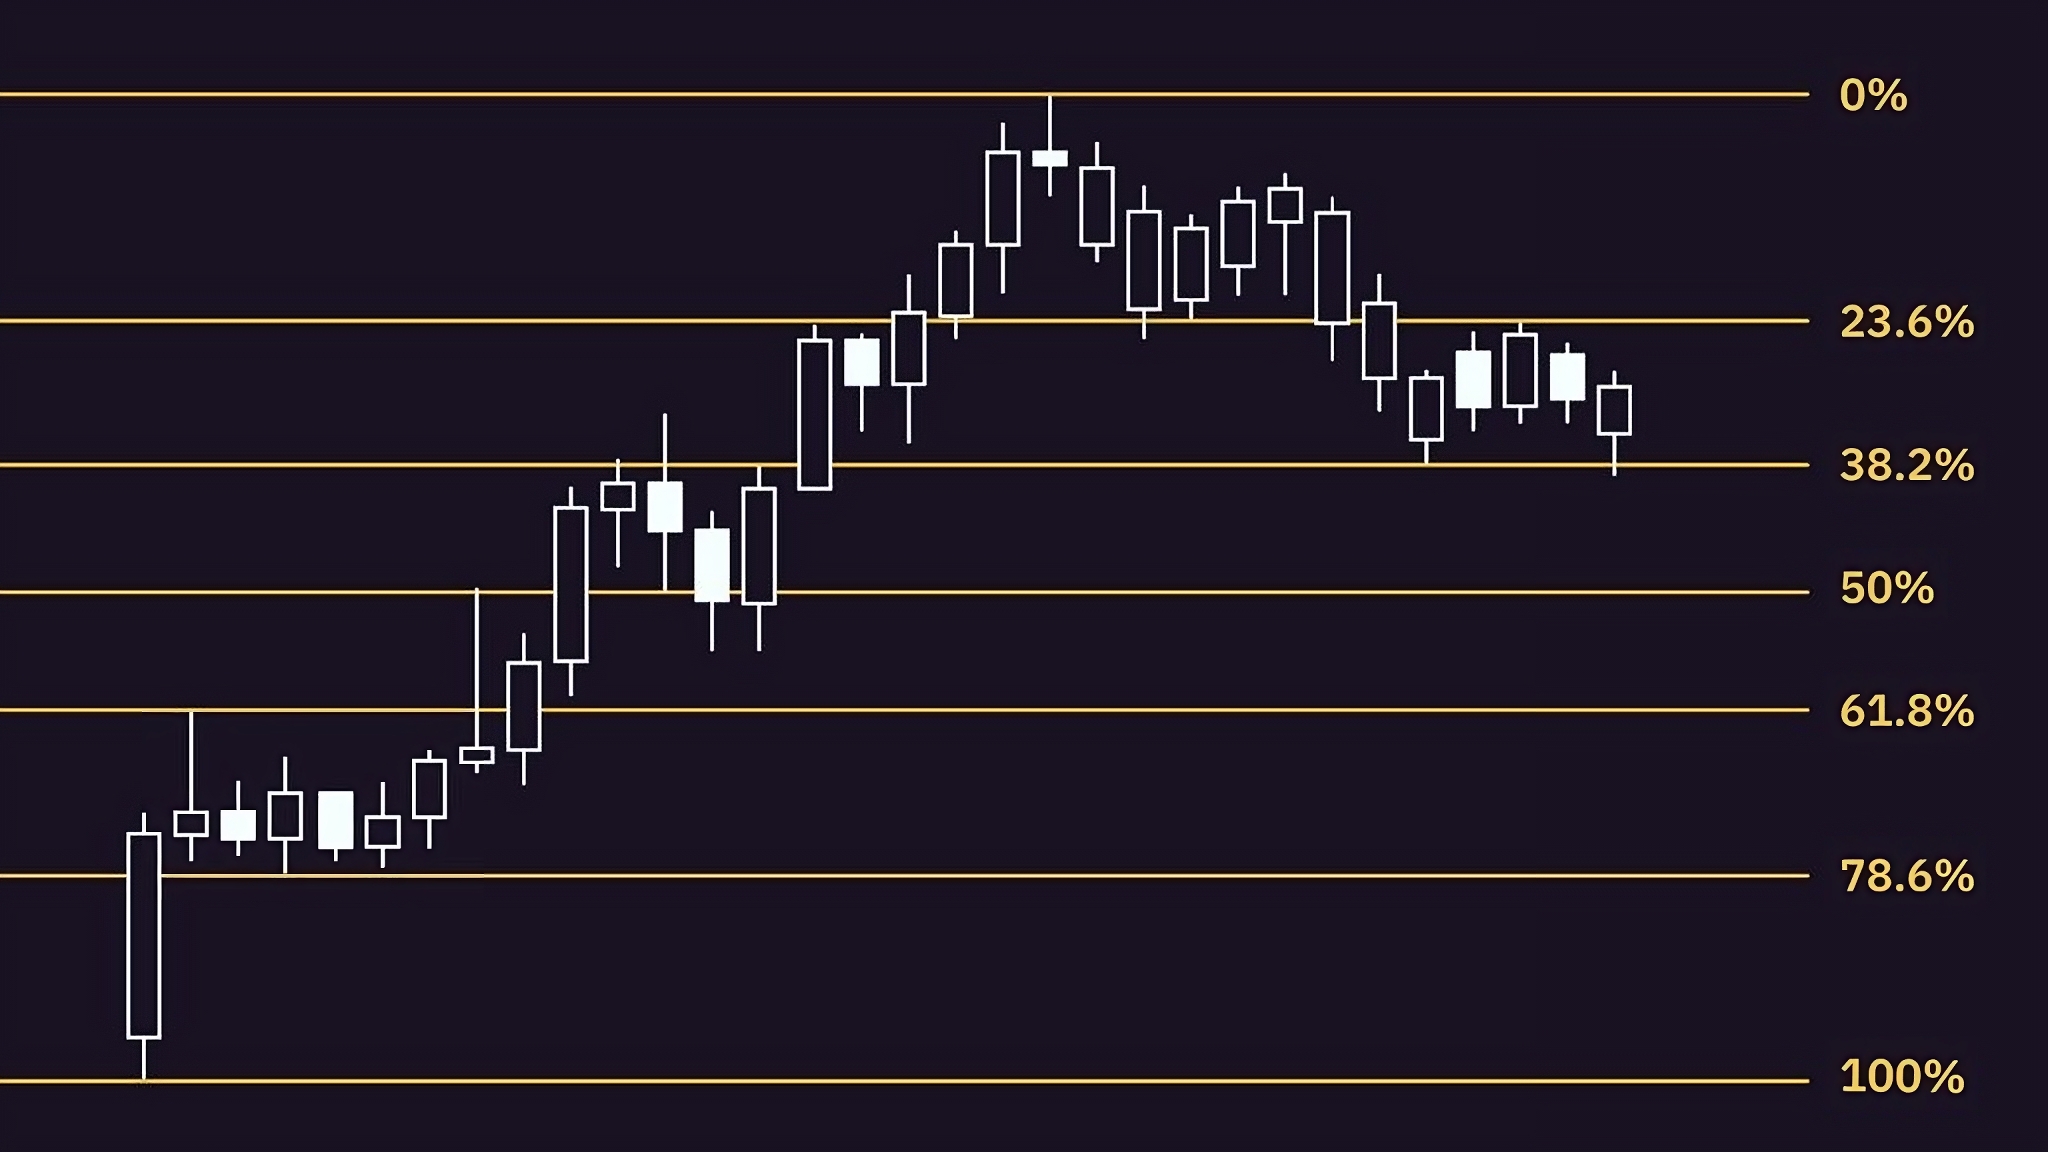
The choice of endpoints changes the result. A daily chart and an hourly chart can produce different zones, and differences also arise if you use candle wicks instead of closing prices. You need a consistent method, not moving the points every time the market disagrees with you.
A Fibonacci calculation example
Let's take a hypothetical example in which Bitcoin moves from 20,000 to 40,000 price units. The numbers are purely for illustration, not current prices or estimates. The range of the rally is 20,000 units.
If you measure how far the price pulls back from the high, the calculation is: retracement level = high − (range of the move × retracement percentage).
- 23.6% retracement: 40,000 − 4,720 = 35,280.
- 38.2% retracement: 40,000 − 7,640 = 32,360.
- 50% retracement: 40,000 − 10,000 = 30,000.
- 61.8% retracement: 40,000 − 12,360 = 27,640.
This is where people often get confused: a 61.8% retracement from the high is not calculated by adding 61.8% of the range to the low. Before you read any chart, check which end the percentage is measured from.
How Fibonacci extensions differ
Retracement levels look at the pullback within the range of a previous move. Fibonacci extensions project ratios beyond that range, with 161.8% being a common example.
Some extension tools use three points: the start of a move, its end and the end of the retracement that followed. These projections describe a hypothetical scenario, not a price the market is bound to reach.
Risks and pitfalls in the analysis
The main limitation is that the measurement is subjective. With enough different endpoints and timeframes, you can almost always find some line close to a past reaction. That shows how easily an explanation can be fitted after the fact, not that its predictive value has been proven.
A price can cut through level after level without any real reaction. News, thin liquidity or the forced closing of leveraged positions can override any geometric ratio. There's no universal success rate that holds for every cryptocurrency and every period.
In practice, analysts often look at previous highs and lows, trading volume and the broader trend together. Even when these line up with a Fibonacci level, their agreement is no guarantee.
Our view
The Cryptonomy team sees Fibonacci as useful as a common language for describing a move. It lets us say how deep a correction was and which areas we're watching, as long as we clearly state the points we measured from and our caveats.
For users in Greece, the chart's trading pair matters too: a crypto priced in euros is not the same chart as the same crypto priced in dollars or a stablecoin. Changes in the exchange rate can affect the picture. The mathematical precision of the calculation doesn't mean the prediction is precise.
Frequently asked questions
What is the Fibonacci system?
In technical analysis, it's the use of ratios related to the Fibonacci sequence to map out potential support and resistance zones. On its own, it isn't a complete strategy.
What are the first numbers of the Fibonacci sequence?
They are 0, 1, 1, 2, 3, 5, 8, 13, 21, 34 and 55. Each new number equals the sum of the two before it.
Why is 61.8% used on charts?
It comes from the limit of the ratio of a number in the sequence to the next one, and it's linked to the golden ratio. Its mathematical origin doesn't guarantee that the price will react there.
Does Fibonacci work on all cryptocurrencies?
It can be drawn on any chart with enough data. How useful it is depends on how it's applied and on market conditions, with no guaranteed result.
Does Fibonacci predict whether the price will go up or down?
No. It measures the ratios of a chosen move and helps organize possible scenarios. On its own, it doesn't determine the direction of the trend or ensure that a level will hold.