Introduction to technical analysis
An introduction to technical analysis, to help you start your journey into the magical world of cryptocurrency and investing smoothly.


Using technical analysis
Technical analysis is the art of forecasting future price changes based on past price action and trading volume on a chart.
Alongside it, various technical indicators have been developed that can be applied to the chart and used to build technical analysis theories. Indicators like these, which we will cover in future articles, help us better understand the state and psychology of the market.
Technical analysis is applied to stocks, cryptocurrencies, commodities, futures contracts or any tradable instrument whose price is governed by the forces of supply and demand.
A little history of technical analysis
Technical analysis was first discovered and used in Japan in the 1700s, when Japanese rice merchants traded using price charts that were later called Japanese candlesticks.
Candlesticks had an edge at the time because they captured intraday price changes (open, close, high and low), reflecting the psychology of the market.

Image: A chart using candlesticks.
In 1890, Charles H. Dow, then editor of the Wall Street Journal in the United States and considered the “father” of technical analysis, laid the foundations for its spread in the Western world through a long series of articles and, above all, through his theory, the Dow Theory.
Although it dates back to the late 19th century, Dow Theory remains the foundation on which much of what we now know as technical analysis was built.
Other pioneers of technical analysis include Ralph Nelson Elliott, William Delbert Gann and Richard Wyckoff, who developed their own techniques in the early 20th century. More technical tools and theories have been developed and refined over the past decades, with a growing emphasis on computer-assisted techniques using purpose-built software such as TradingView, Coinigy, CryptoView and others.
Core principles of technical analysis
The three most important principles of technical analysis are:
- Market action discounts everything.
- Prices move in trends.
- History repeats itself in price movements.
Market action discounts everything
Technical analysts believe that the current price fully reflects all the potentially significant information that could affect it.
The price therefore reflects the combined knowledge of all participants, including traders, investors, portfolio managers, buy-side analysts, sell-side analysts, market strategists, technical analysts, fundamental analysts and many others. It would be naive to disagree with a price set by such an impressive lineup of people with impeccable credentials. Technical analysis looks at price and assumes it will behave in the future the same way it did in the past under similar conditions.
Prices move in trends
Trading with the trend is the core logic of technical analysis. Once a trend is established, future price changes are more likely to be in the same direction as the trend than against it.
History repeats itself in price movements
People have used charts and chart patterns for decades, spotting patterns in price changes that often repeat. The repetitive nature of price changes is attributed to market psychology. In other words, market participants tend to react consistently to similar market stimuli over time.
There are three types of market trends
Markets go through primary trends that last a year or more, such as a bull market or a bear market. A bull market is a market that is rising, while a bear market is one that is falling.
Within these broader trends, markets experience secondary trends, which are often seen as a move against the primary trend, such as a retracement within a bull market or a rally within a bear market. These secondary trends last from three weeks to three months. Finally, there are minor trends that last less than three weeks and are generally considered noise.

Image: Chart of “APPLE” stock showing the primary and secondary trend.
Trends persist until a clear reversal appears.
A reversal is a change in the direction of the price of an asset, such as a cryptocurrency or a stock.
A reversal can happen to the upside or the downside.
- After an uptrend, a reversal would be to the downside.
- After a downtrend, a reversal would be to the upside.
Reversals are based on the overall direction of price and usually not on one or two periods/bars on a chart.
Reversals in primary trends can be confused with secondary trends. Telling whether a bull market is reversing (the start of a bear market) or is just in a short-term correction followed by higher highs is difficult, so Dow Theory urges caution, insisting on confirmation of a primary trend reversal.
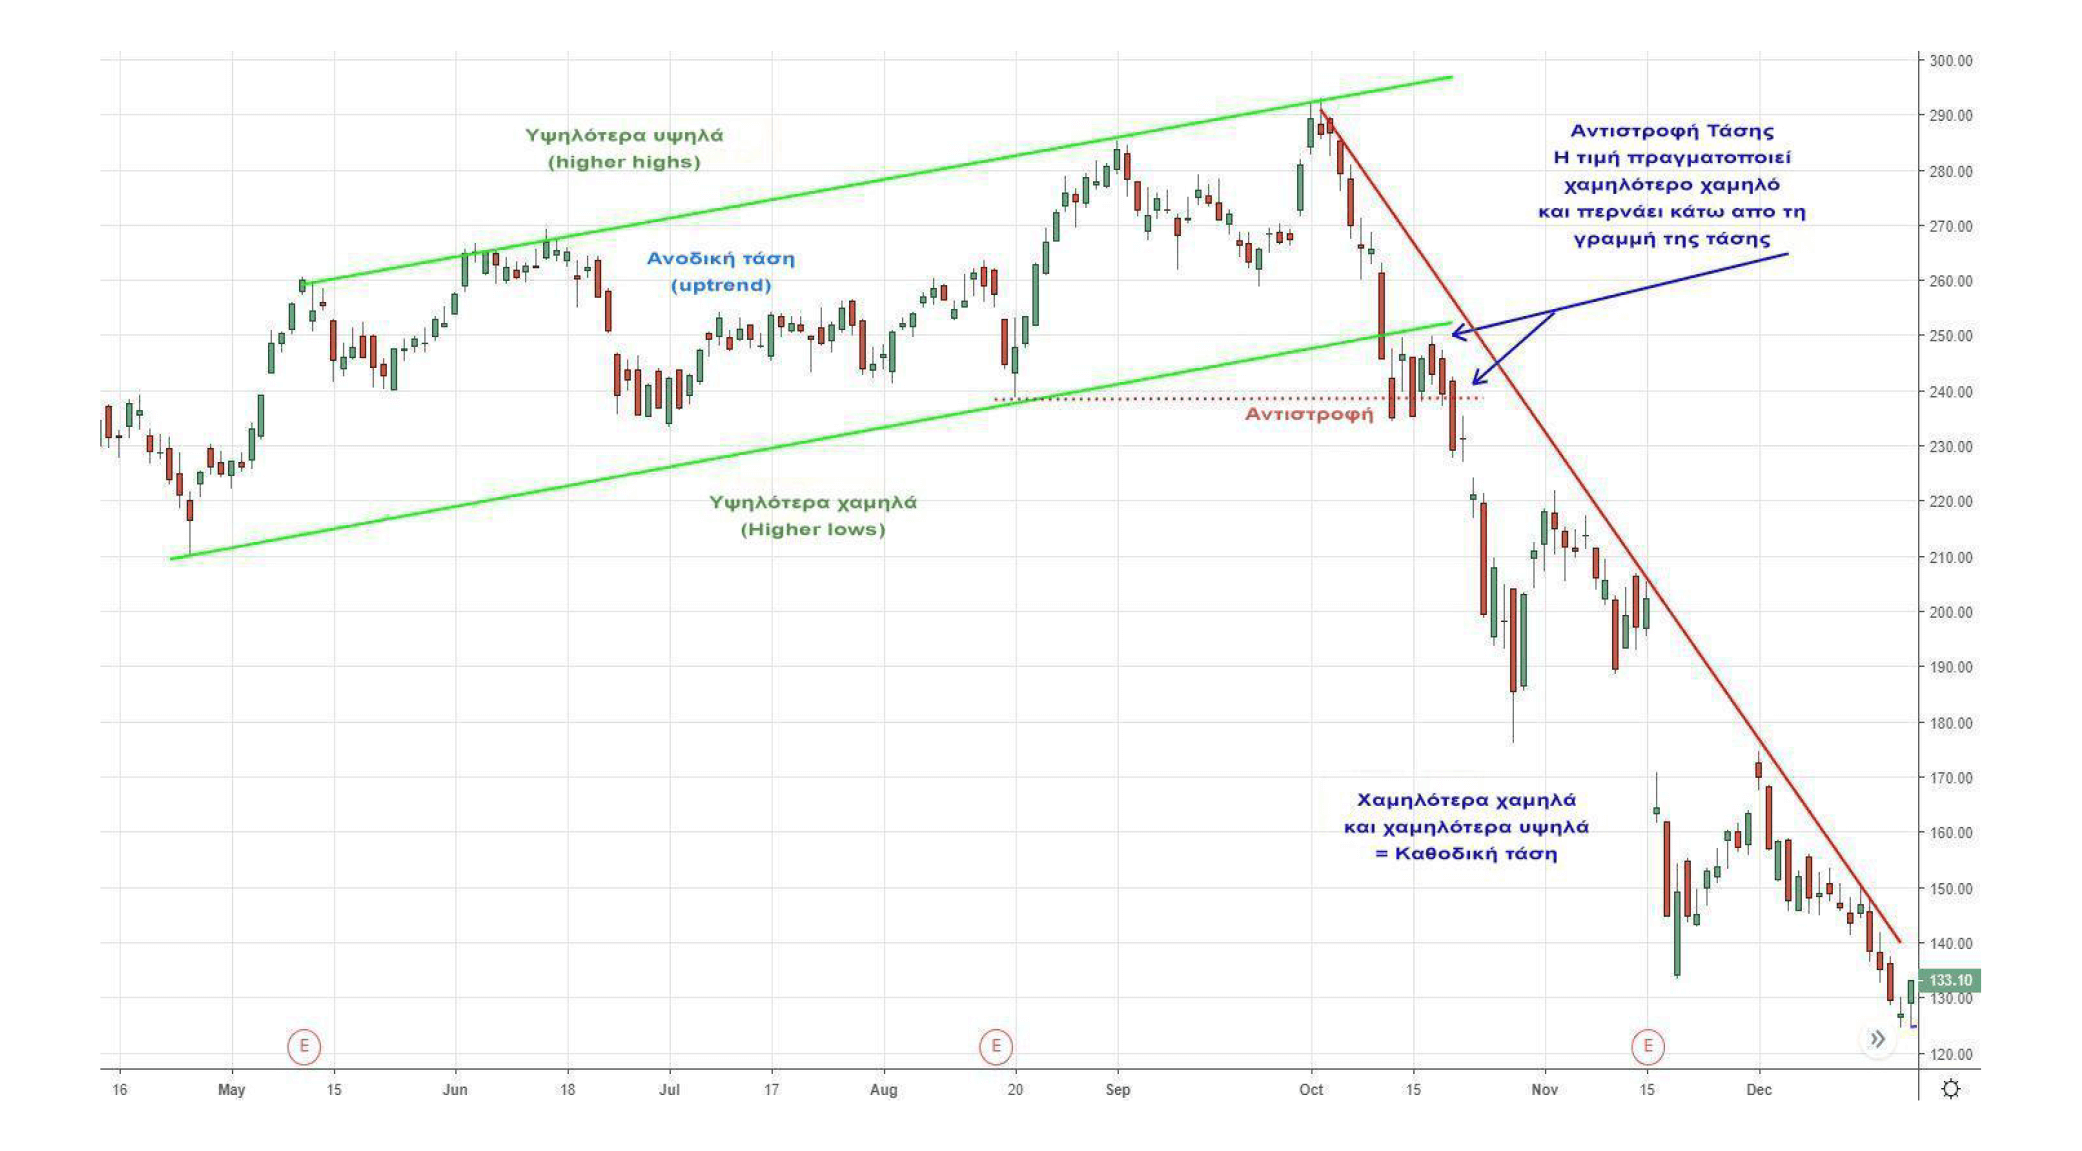
Image: A trend reversal.
Which is the better method: fundamental or technical analysis?
Fundamental and technical analysis are two completely different approaches. However, many investors use both fundamental and technical analysis when making investment decisions, as technical analysis helps fill knowledge gaps and complements the former. By developing an understanding of technical analysis, investors can improve their long-term returns and get a more complete picture of the market. Technical analysis undoubtedly helps identify the right moments when a trend may be strengthening, slowing down or even reversing, since that kind of information is not reflected in the fundamentals of the traded product (stock, derivative, currency, etc.).
In our upcoming articles, we will talk in more detail about charts, candlesticks, trends and trend reversals, volume, support and resistance levels, and the most important technical indicators and tools, so we can start broadening our understanding of technical analysis and shape the investment strategy that suits us.