Market cap analysis June 7, 2021
An analysis of the total market cap of the cryptocurrency market.


Technical indicators
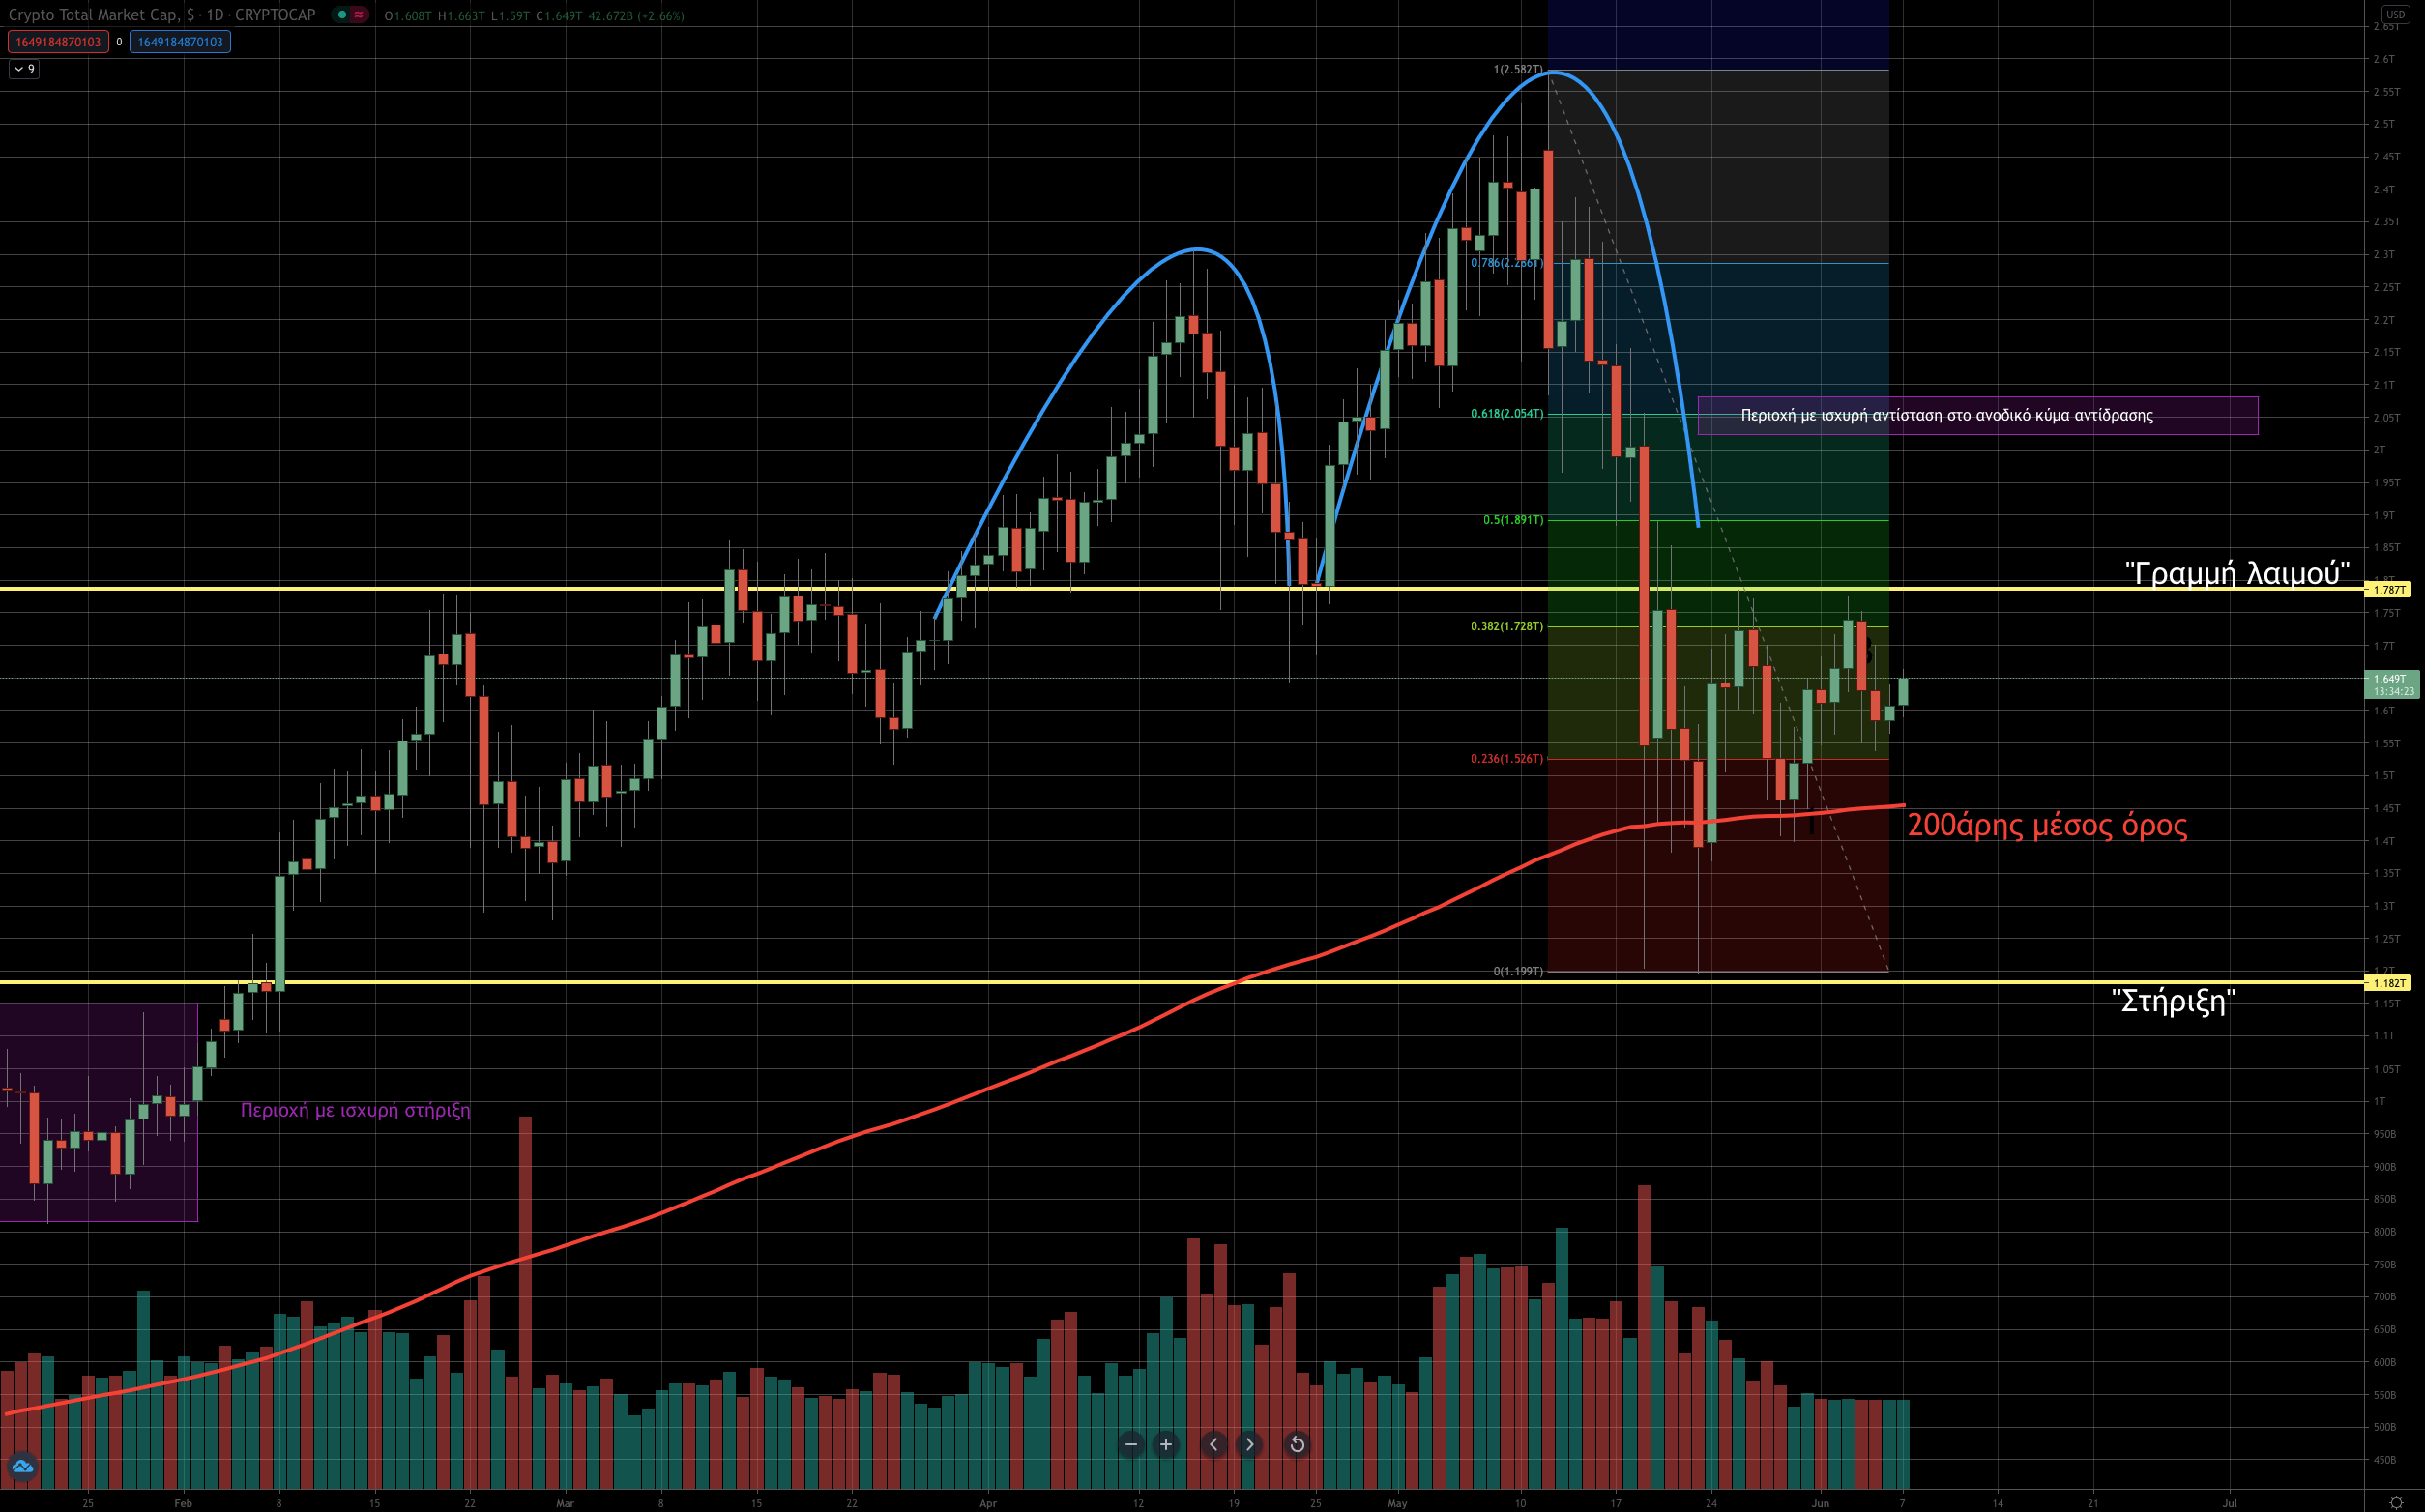
Let us first walk you through the chart: we have drawn the market’s two latest “local tops” with the blue lines, a neckline in yellow at 1.78 trillion, a support at 1.18 trillion, the 200-day exponential moving average as a red line, as well as the Fibonacci levels (from the all-time high at 2.58 trillion -> down to the 1.2 trillion of the recent big correction we saw, and the lows.
Analysis
Over the latest period, since mid-May, the market has behaved as follows: during the downward move we saw the market break below the neckline with force (elevated volume), a development that triggered the bearish scenario, on the basis of which many analysts started talking about an upcoming “bear market.” The market then found some support at the 200-day moving average and bounced up to the neckline area. That is where, at the local lows, we also drew the support line.
Right now the market is moving sideways and is essentially waiting for a “catalyst” to decide its next direction. We want to point out that during the two tops we saw volume (shown at the bottom of the chart as vertical red and green bars) running high on the down days, which tells us that distribution took place, or in other words that quite a few people probably emptied or lightened their wallets. From a technical standpoint, the market is most likely at the start of a bear market, as it struggles to move higher. To confirm this scenario we would need to see a breakdown below the lows at 1.2 trillion on high volume. That would bring in more sellers, as more stop losses would be hit. For now, as we said, the market is in wait-and-see mode, as trading activity (volume) has dropped significantly over the last ten days and traders are waiting for developments. We are focusing on the 2 areas (the neckline and the support) to see how the market behaves if it approaches them.