The future of XRP
A technical analysis of the future of XRP. We analyze Ripple’s cryptocurrency, XRP.


 XRP today
€0.8670
−3.8% in 24h
Price and chart
In today’s analysis we focus on the future of XRP, based on the most recent period from May 16 onward, which is highlighted in color on the chart.
On the daily chart we can see that XRP started falling from $1.70 and dropped as low as $0.67. The $0.67 area was also the strong support provided by the 200-day moving average (purple), which acted as a “spring” for the bounce that followed, a move that in theory is still in play.
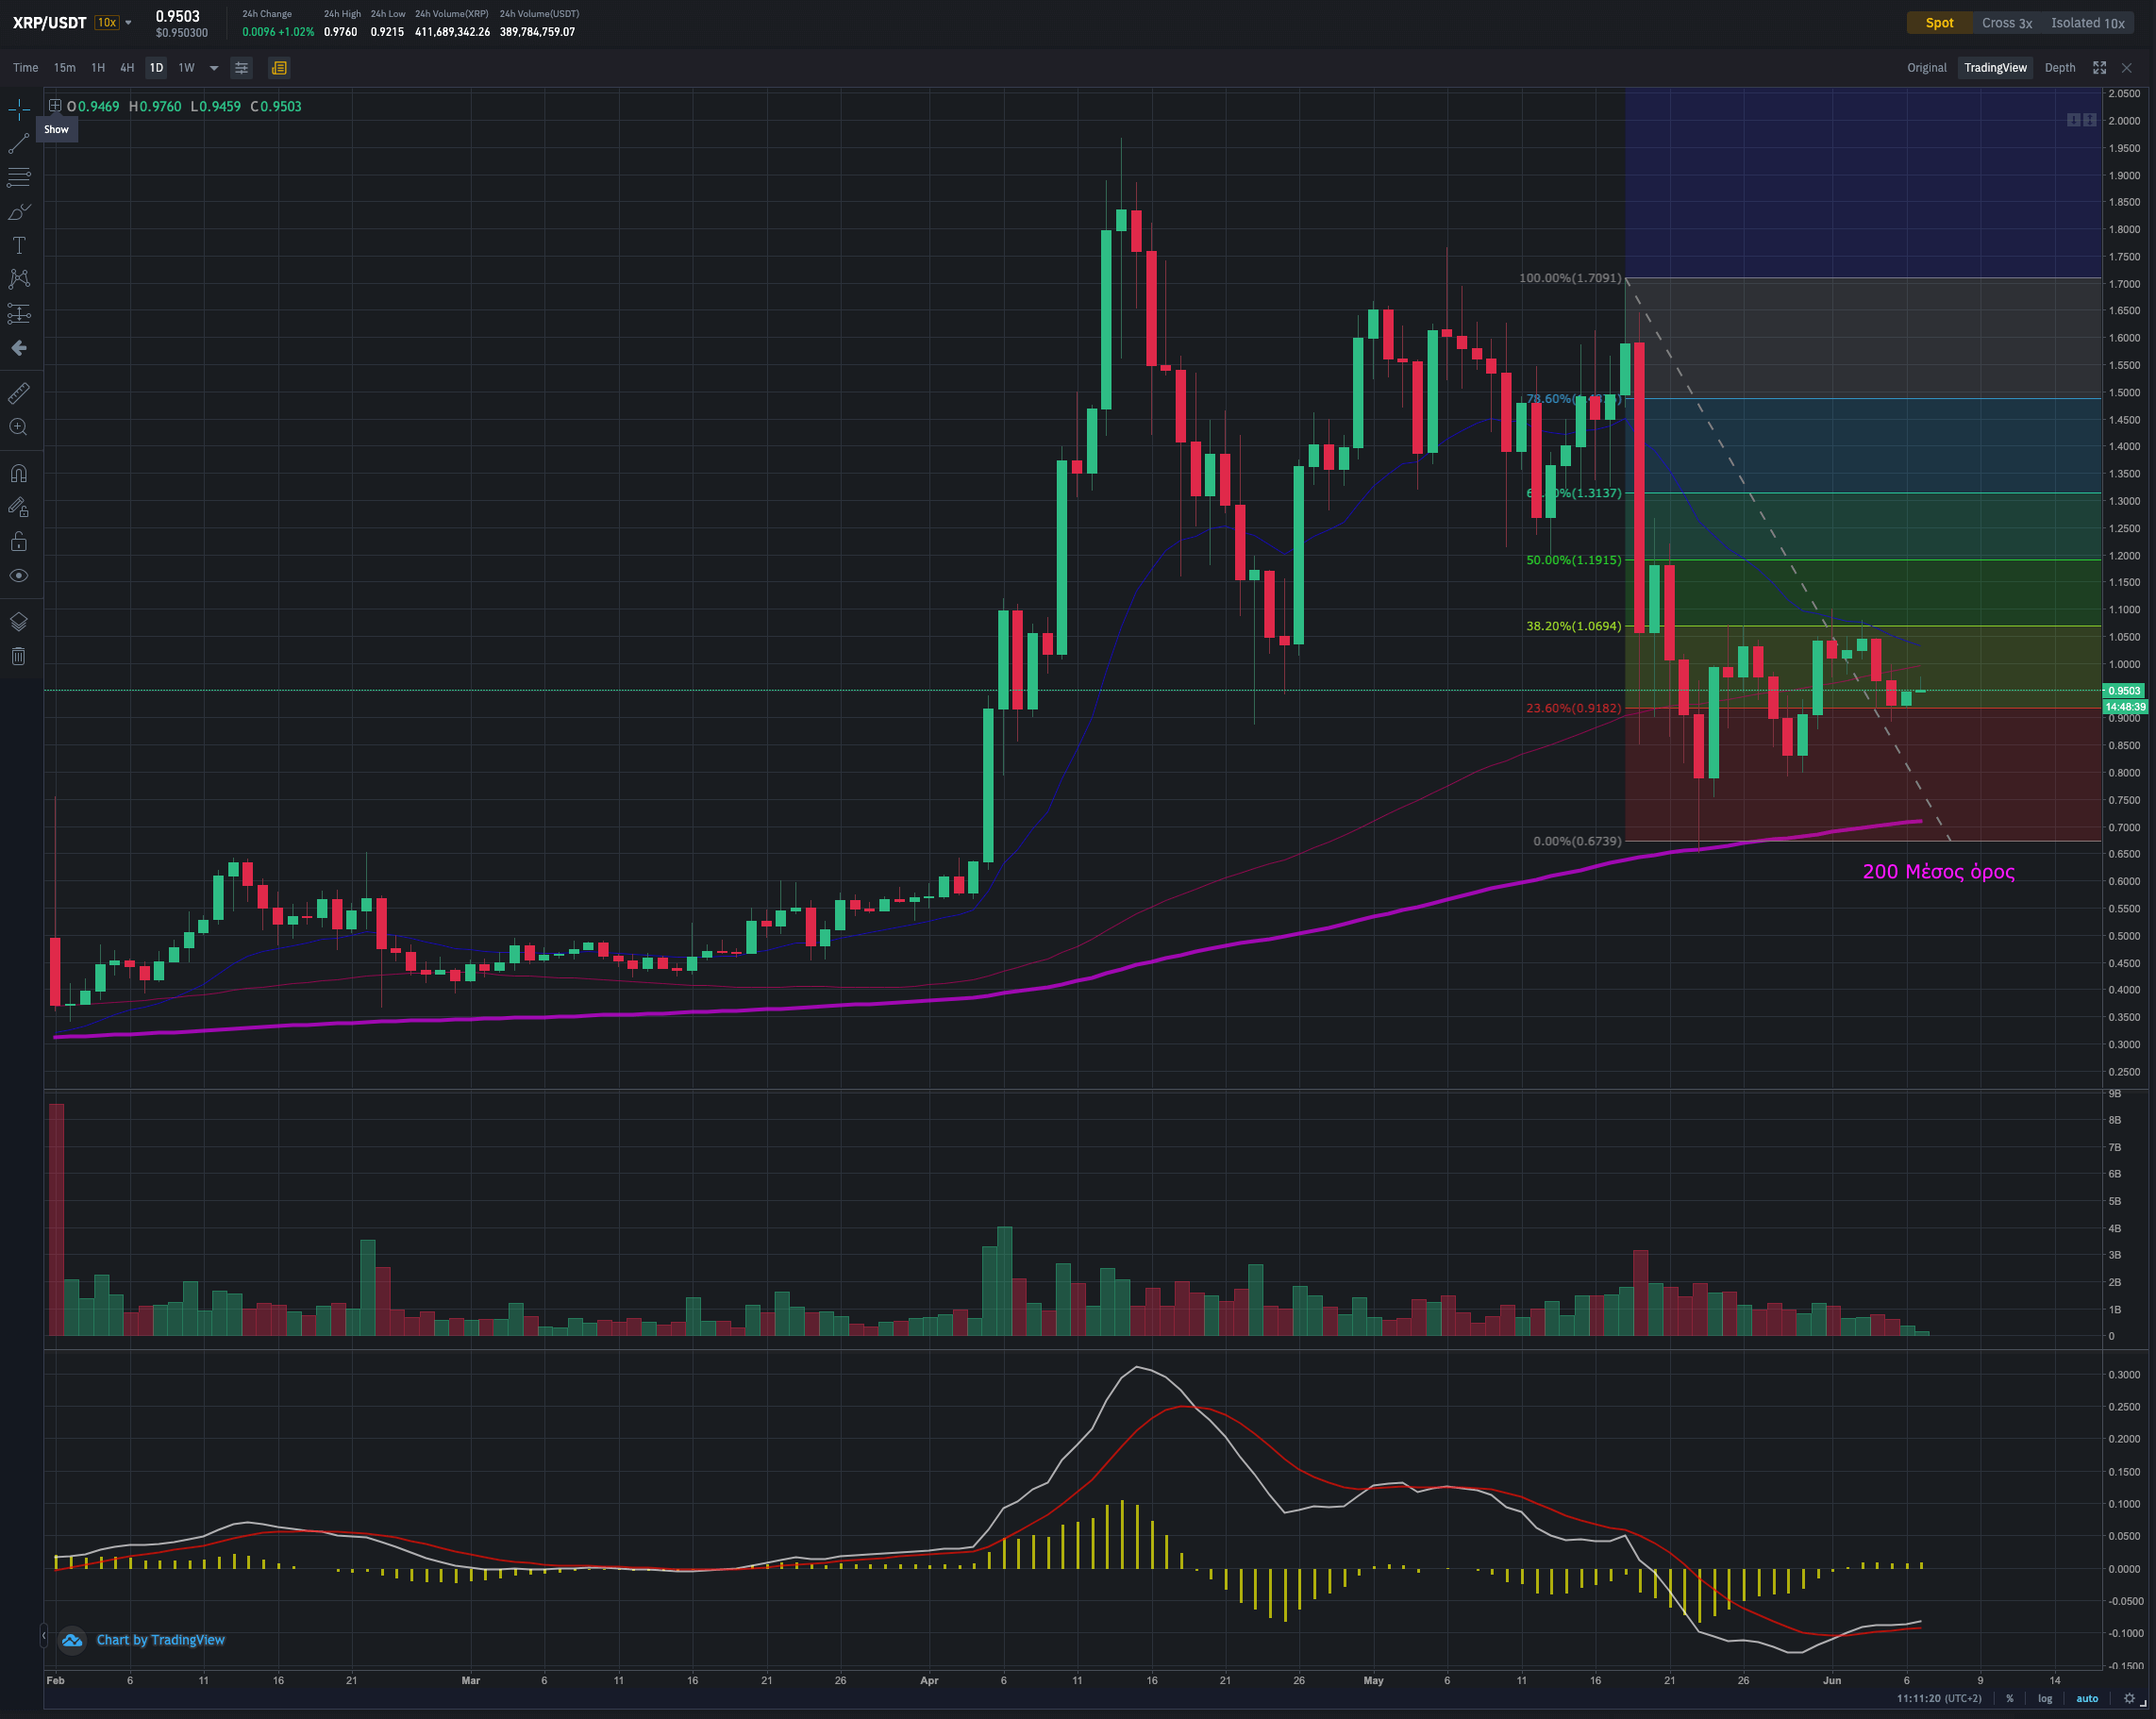
The drop of XRP from $1.70 to $0.67 was fairly steep compared with the rest of the market, at more than 50%. Note that its second leg came with a new low on May 23, something we did not see in the rest of the market. This makes us somewhat fearful and skeptical, since it showed that the market wanted to “dump coins.” The first leg was, in theory, the one-day drop of May 17, which bottomed around $0.85.
In the latest period we see a bounce up to the $1.07 area, which coincides with the 38.2% Fibonacci level. This is considered simply a bounce off the support that the 200-day moving average provided in theory, essentially a technical rebound, as technical analysts call it.
The truth is that we would not put XRP on the “top pick” of our list, as its picture looks worse than the rest of the market’s.