

Elliott Wave is a technical analysis method that interprets price movements as repeating wave patterns tied to investor psychology. Its basic picture is a five-wave move in the direction of the main trend followed by a three-wave correction, though this is no guarantee of a forecast.
What Elliott Wave Theory is
Ralph Nelson Elliott, an American accountant, developed his theory in the 1930s by studying stock market charts. He argued that the collective behavior of investors creates repeating structures in prices, as optimism alternates with fear.
Think of a rising market: some people buy early, others have doubts, and later enthusiasm takes over. The theory tries to organize these swings into waves. However, it doesn’t measure sentiment directly, nor does it prove that every fluctuation has a specific psychological cause.
The name Elliott Wave Theory describes this approach. You’ll also see it called Elliott Waves, while the spelling “Elliot” with a single final t is common but doesn’t match its creator’s surname.
How waves 1–5 and A–B–C work
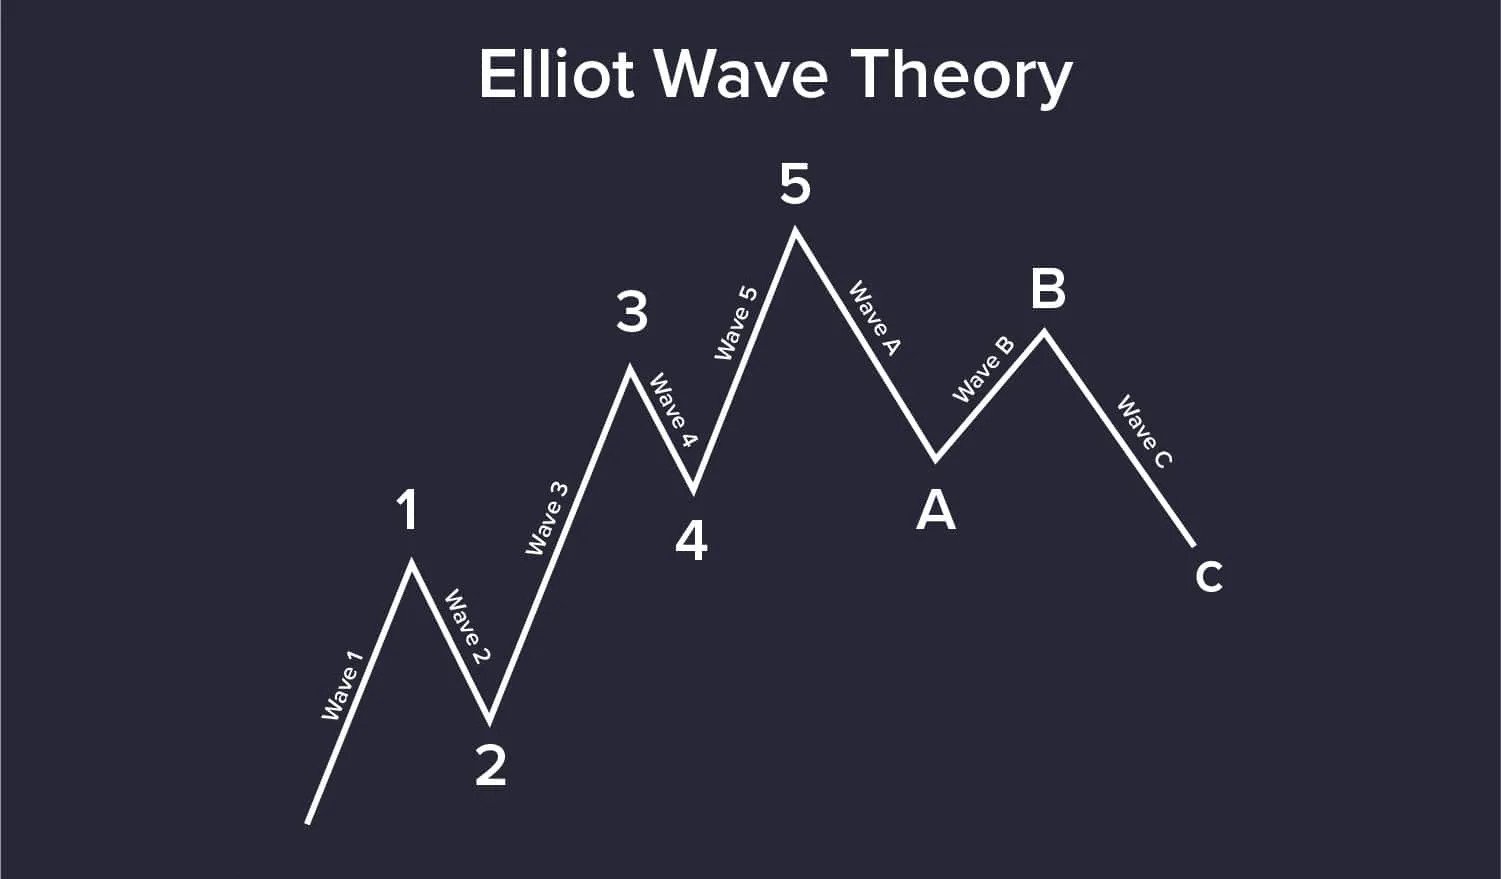
The basic pattern consists of a five-wave motive move and a corrective phase, often of three waves. In an uptrend example, waves 1, 3 and 5 move up, while waves 2 and 4 pull back, retracing part of the previous move.
The motive phase
Wave 1 starts the move and wave 2 pulls back against it, without wiping out its starting point. Wave 3 continues in the main direction, wave 4 brings a new correction and wave 5 completes the five-wave structure.
Note the difference: not all five waves go up. Also, a motive structure can point down when the main trend is bearish. The numbers describe the position within the pattern, not necessarily a rise.
The corrective phase
After the five-wave move, the simplest example of a correction is labeled A–B–C. In a bull market, A pulls back, B rebounds and C pulls back again.
The real picture isn’t always that neat. There are zigzags, flats, triangles and combinations of them. So A–B–C is a starting point for understanding, not a template for every chart.
The basic rules of an impulse wave
The most common five-wave motive structure is called an impulse wave. For such a count to hold up, it must follow some basic rules:
- Wave 2 may not retrace all of wave 1 by moving back past its starting point.
- Wave 3 cannot be the shortest in price length among waves 1, 3 and 5.
- Wave 4 must not enter the price territory of wave 1.
The last rule applies to the standard impulse. Diagonals have different characteristics and allow overlap. But it isn’t enough to label every problematic pattern a “diagonal” just to save our original call.
A rule is one thing; typical behavior is another. For example, wave 3 often shows strong momentum, but it isn’t necessarily the longest. Likewise, the alternation between a sharp and a sideways correction in waves 2 and 4 is a guideline, not an unbreakable law.
Why the count changes with the timeframe
One wave on a daily chart can contain a whole sequence of smaller waves on an hourly chart. This appearance of similar structures at different scales is called a fractal structure.
Picture a map: from far away you see one main road, while zooming in reveals its bends. In the same way, a small pullback may be a correction within an uptrend, while that same uptrend may be part of a larger downtrend.
That’s why the timeframe should be stated up front. Constantly switching charts until the desired pattern shows up makes the analysis harder to test.
Elliott Wave and Fibonacci
Analysts often combine Elliott waves with Fibonacci ratios. Fibonacci retracements measure how much of a previous move the price has given back, while Fibonacci extensions project possible proportional lengths for a following move.
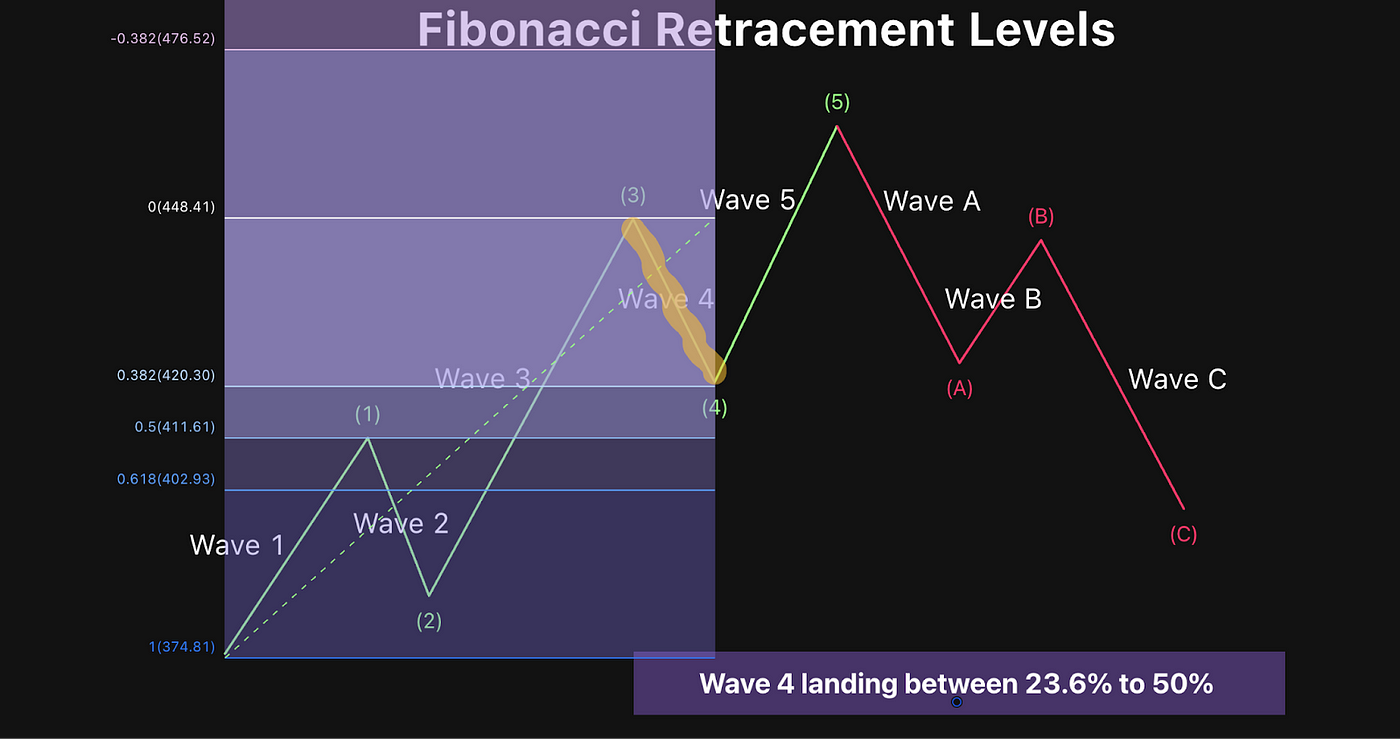
In practice, the ratios are used to check whether a correction or a motive move fits the hypothetical scenario. They don’t dictate where the market will stop, and on their own they don’t confirm the count.
The choice of start and end points changes the measurements. If we keep moving the points so that the lines line up with the price, we are fitting the explanation to the outcome instead of testing a hypothesis.
How to apply it to a chart in practice
We believe the method is most useful for organizing alternative scenarios. A consistent reading process can follow these steps:
- Pick a timeframe and look at the bigger trend before focusing on the small moves.
- Identify the obvious highs and lows, without numbering every small fluctuation.
- Draw a possible count and check whether it breaks the rules of that particular structure.
- Write down which development would invalidate it and what alternative interpretation exists.
- Compare the picture with the trend, trading volume and other independent indicators.
For example, if a pullback has been labeled wave 2 of a bullish structure and then drops below the start of wave 1, that count is rejected. We don’t just fix the numbering after the fact without admitting that the original hypothesis failed.
What’s different with crypto
The theory is also applied to charts of Bitcoin and other cryptocurrencies, but round-the-clock trading and sharp swings make them harder to read. A news event, thin liquidity or forced liquidations can change the picture quickly.
There is also a practical detail for readers in Greece: the same cryptocurrency can show different highs against the euro and against a stablecoin. You need to be consistent about the trading pair, the data source and the timeframe.
Also, a wave count doesn’t assess a protocol’s security, the quality of its team or the sustainability of a token. The technical picture doesn’t replace research into the project itself.
The pitfalls and our take
The biggest obstacle is subjectivity: two analysts can count the same chart differently. The more complex structures are brought in, the easier it becomes to find an explanation after the fact for almost any move.
There is also the trap of confirmation bias. When we expect a rise, we may see a wave 3 “coming” everywhere and ignore the evidence that disagrees. The chart doesn’t owe it to us to prove our count right.
The Cryptonomy team sees Elliott Wave as a useful framework for observation, not a machine for certain predictions. We think it offers more when it comes with clear invalidation rules and an honest assessment of failed scenarios. The approach above is educational and is not a trading recommendation.
Frequently asked questions
What does Elliott Wave mean?
It refers to Elliott Wave Theory. It is a technical analysis approach that looks for repeating structures in prices and links them to the collective psychology of investors.
What are the five Elliott waves?
In the standard motive structure, waves 1, 3 and 5 follow the main direction, while waves 2 and 4 move against it. The main direction can be up or down.
Is wave 3 always the longest?
No. In a standard impulse it may not be the shortest of waves 1, 3 and 5, but that doesn’t mean it always has to be the longest.
Can Elliott Wave predict the price of Bitcoin?
It can be used to frame scenarios, not to make certain predictions. The count is interpretive, and a price move can invalidate the original scenario.
Do you need Fibonacci for the count?
No. Fibonacci ratios are complementary, helping you compare moves. They don’t replace the wave rules, nor do they prove that a count is correct.