Bitcoin: Technical analysis for November 9, 2023
Bitcoin: this week’s technical analysis for November 9, 2023, brought to you by Cryptonomy and Altcoin Wonderland. Find out where Bitcoin is likely to head next.


 Bitcoin (BTC) today
€61,062
−1.8% in 24h
Price and chart
Hello from the crazy crew at Altcoin Wonderland!!! It’s Thursday, November 9, 2023, and time to look at what’s next for Bitcoin, which obviously moves the whole crypto market. Are we in a bull market? Will altcoins keep rising for a while longer? Let’s take a look…
Bitcoin monthly chart
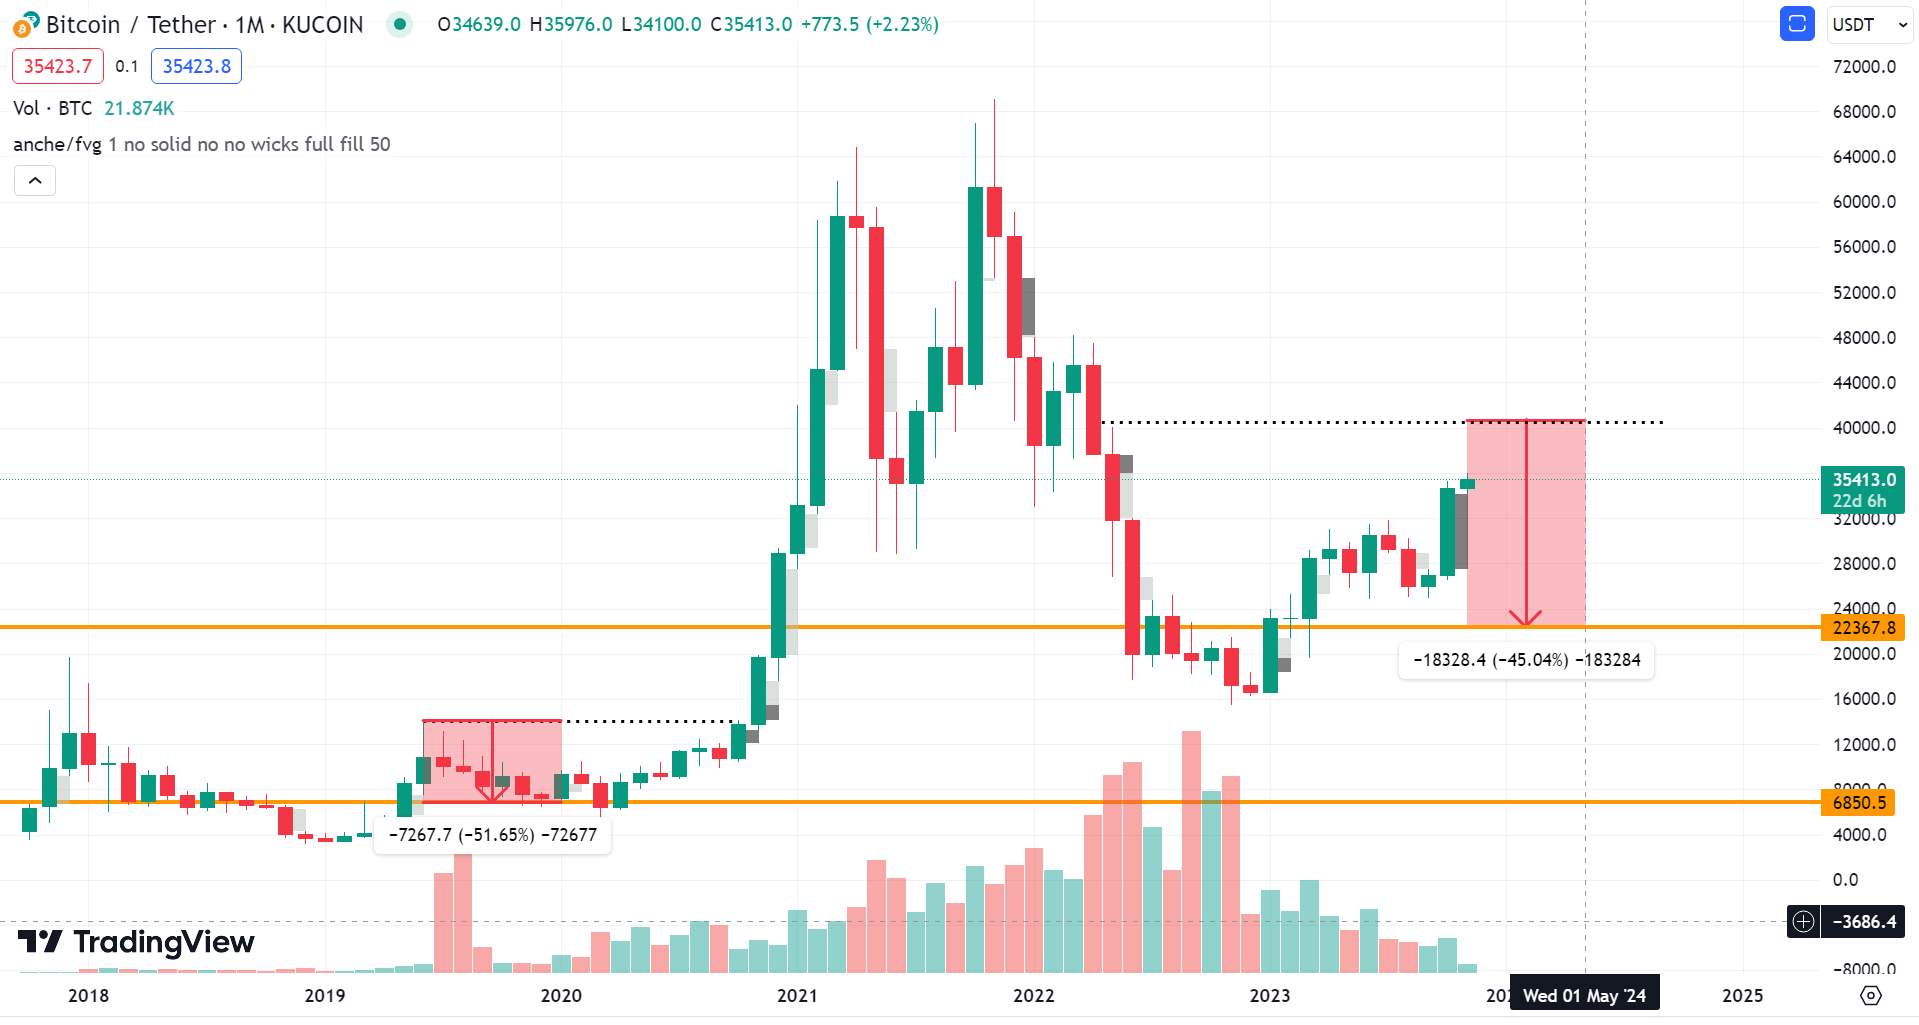
Bitcoin is at 25k–26k, and from a macro view we can see that it may be moving between 17.6k and 65.2k, with the midpoint between 38k and 40k. There is an unfilled monthly fair value gap between 36k and 38k. So although many expect a correction toward 30k from here, the more likely scenario may be that we first see 38k–40k and only then get our correction.

If we get a correction, a reasonable level would be around 31k, which is also the top of the previous range (dashed black lines). Another possible scenario is a touch of 28k, where we have built an FVG on the monthly chart.
On the weekly chart we also see the possibility that we’re moving inside a channel (dashed black lines). So this is roughly how I see things: a touch of 38k, then 28k–30k.

Are we in a bull market?
Looking at the monthly chart and the historical data, we see that in 2017 Bitcoin hit a bull market top, then moved into a bear market until it found the “bottom” in the winter of 2018–2019. From there it bounced, and the price shot up from 4k to 14k in August 2019, which was a local top, and then we had a 50% correction over the next 5–6 months, right before the Bitcoin halving. From the 2017 top of 20k, 14k was about 30% away, and 10k, where the candle body closed in August 2019 after the rally off the “bottom,” was 50% away. I believe we have a similar situation now in 2023: IF we go up to 40k, we’ll be about 40% below the 69k top. And IF a monthly candle body closes at 35k, we’ll be even further away. A −50% correction from 40k would take us to around 22k, which would also be the “neckline” of the 15k–20k bottom we built. We saw something similar in 2019, when Bitcoin’s correction touched 6k, the “neckline” of the 2018 “bottom.” So in one sense we are in a bull market, meaning we most likely won’t see prices below 20k again. In another sense, we logically won’t keep climbing straight to 65k. Obviously, this analysis doesn’t account for unexpected “black swan events.”



That’s it from me. Keep going strong, folks, and be careful! Always use risk management, stop losses and proper position sizing. Happy trading! Thanks a lot!
Find us on our YouTube channel.
For Greek-language crypto trading courses, click here.
Or send us a message on our socials and we’ll put you in touch with the crypto academy we work with.
Want to support the channel? Buy the latest Ledger Nano using this link (affiliate link).