Bitcoin: technical analysis, September 28, 2023
This week’s Bitcoin trading tips come to you from Cryptonomy and the Altcoin Wonderland team. Find out where Bitcoin could be heading next. #episode 1


 Bitcoin (BTC) today
€61,083
−2.0% in 24h
Price and chart
Hello from the crazy crew at Altcoin Wonderland!!! It’s Thursday, September 28, 2023, and it’s time to look at what’s next for Bitcoin, which obviously affects the whole crypto market. Don’t treat anything you read today as investment advice: everything we write is purely for informational purposes.
Bitcoin monthly chart

The 50-month moving average is at 26.6K, and last month closed below it.
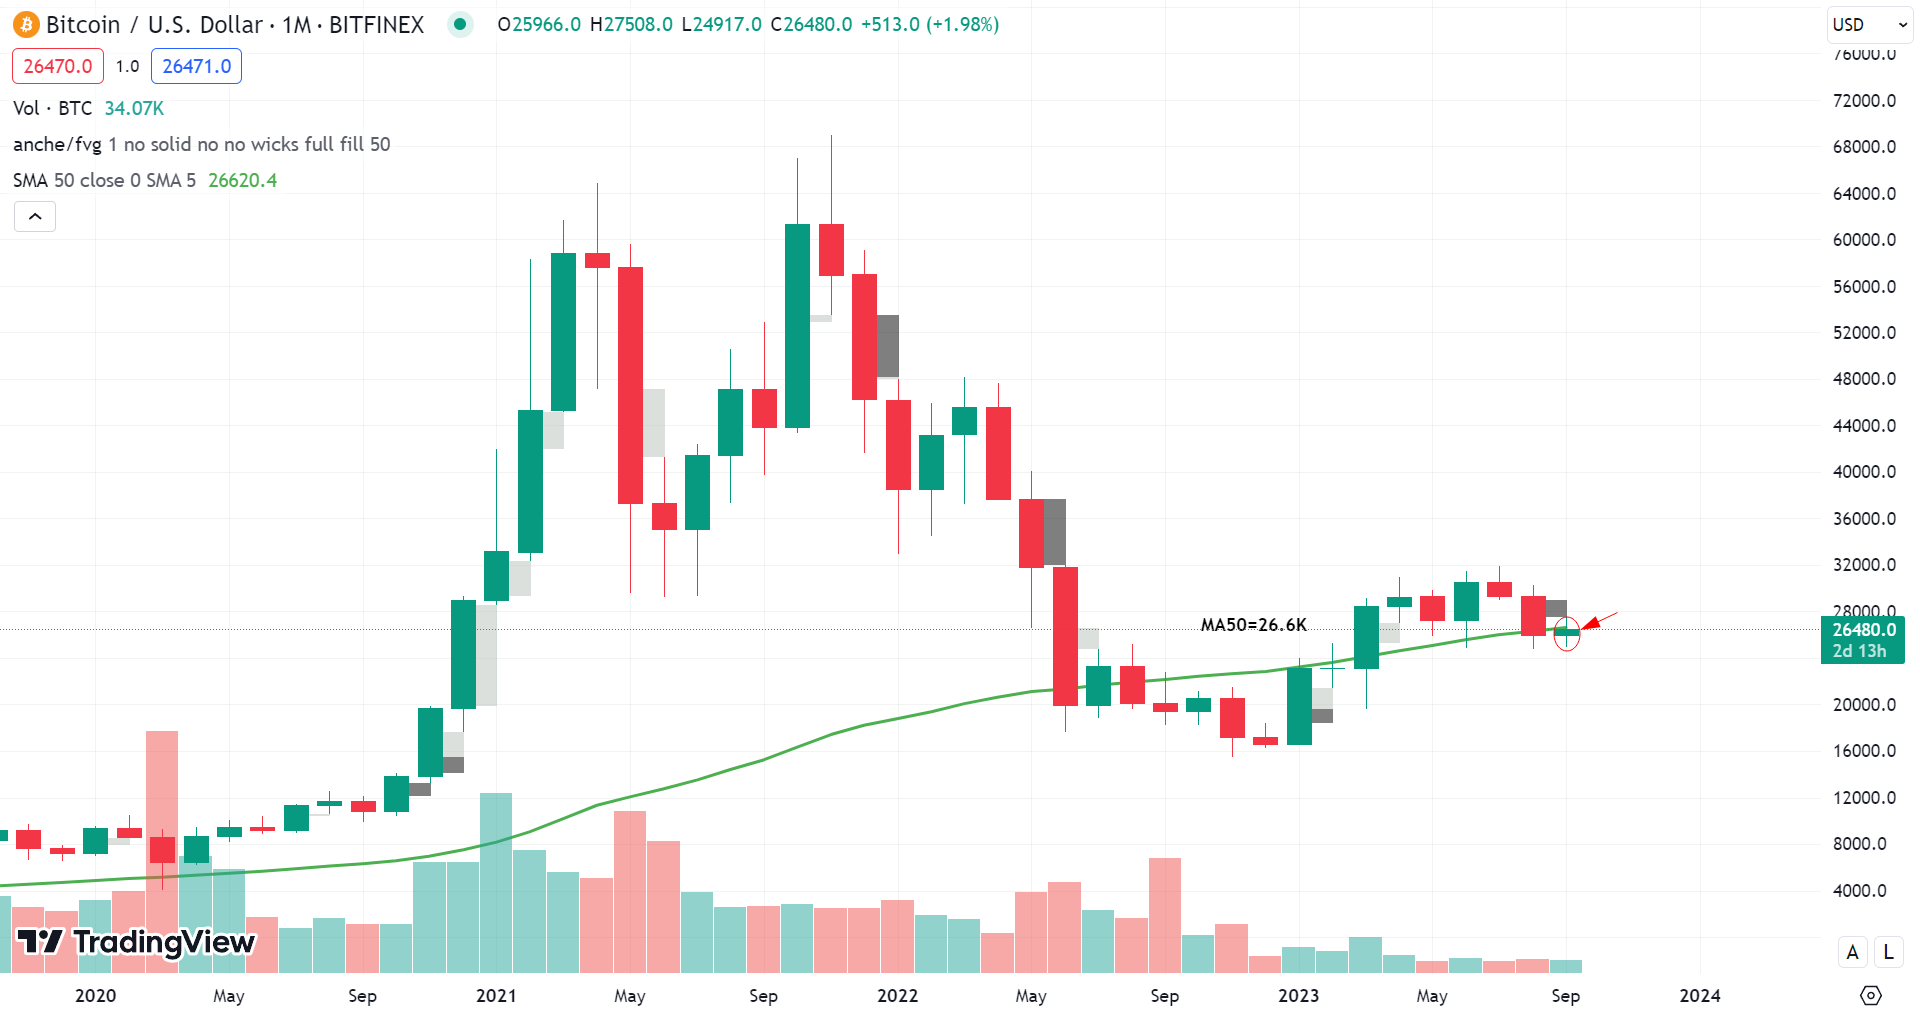
September doesn’t seem able to get back above it, which signals weakness!
Bitcoin weekly chart

Another important level will be the 200-week moving average at 27.9K: we have been below it for several weeks now, and it is pushing the price down. It will certainly act as resistance, so keep it in mind.

Bitcoin appears to have been trading in a range between 17.6K and 31.8K since April 2022. A good spot to go long in terms of risk/reward ratio would be the middle of the range at 24.3K (ideally between 23K and 24K).

That’s also roughly where there is a fair value gap we haven’t filled yet.
Bitcoin daily chart
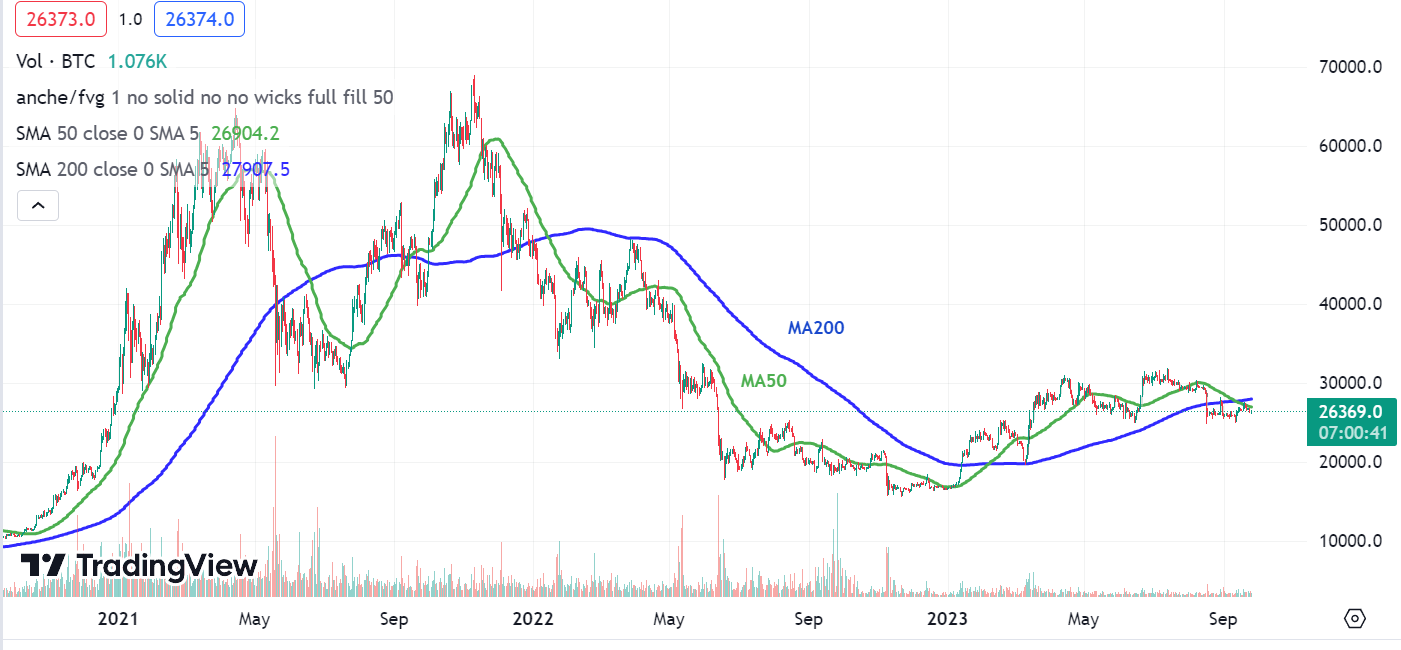
A negative event was confirmed last week on the daily chart. We had a death cross (when the 50-day MA crosses below the 200-day MA). In the recent past this has happened twice: in June 2021, when the price fell 21% after the death cross, and in January 2022, when the bear market was well under way and the price fell 64% before finding a “bottom” in November 2022. So IF the same happens now, the minimum drop would be 20%, to a Bitcoin price of $20,000. The worst-case scenario, a 64% drop to $10,000 per bitcoin, is very unlikely, but never say “never.”


Now a few final words on the daily chart, to see what we notice over a shorter time horizon.
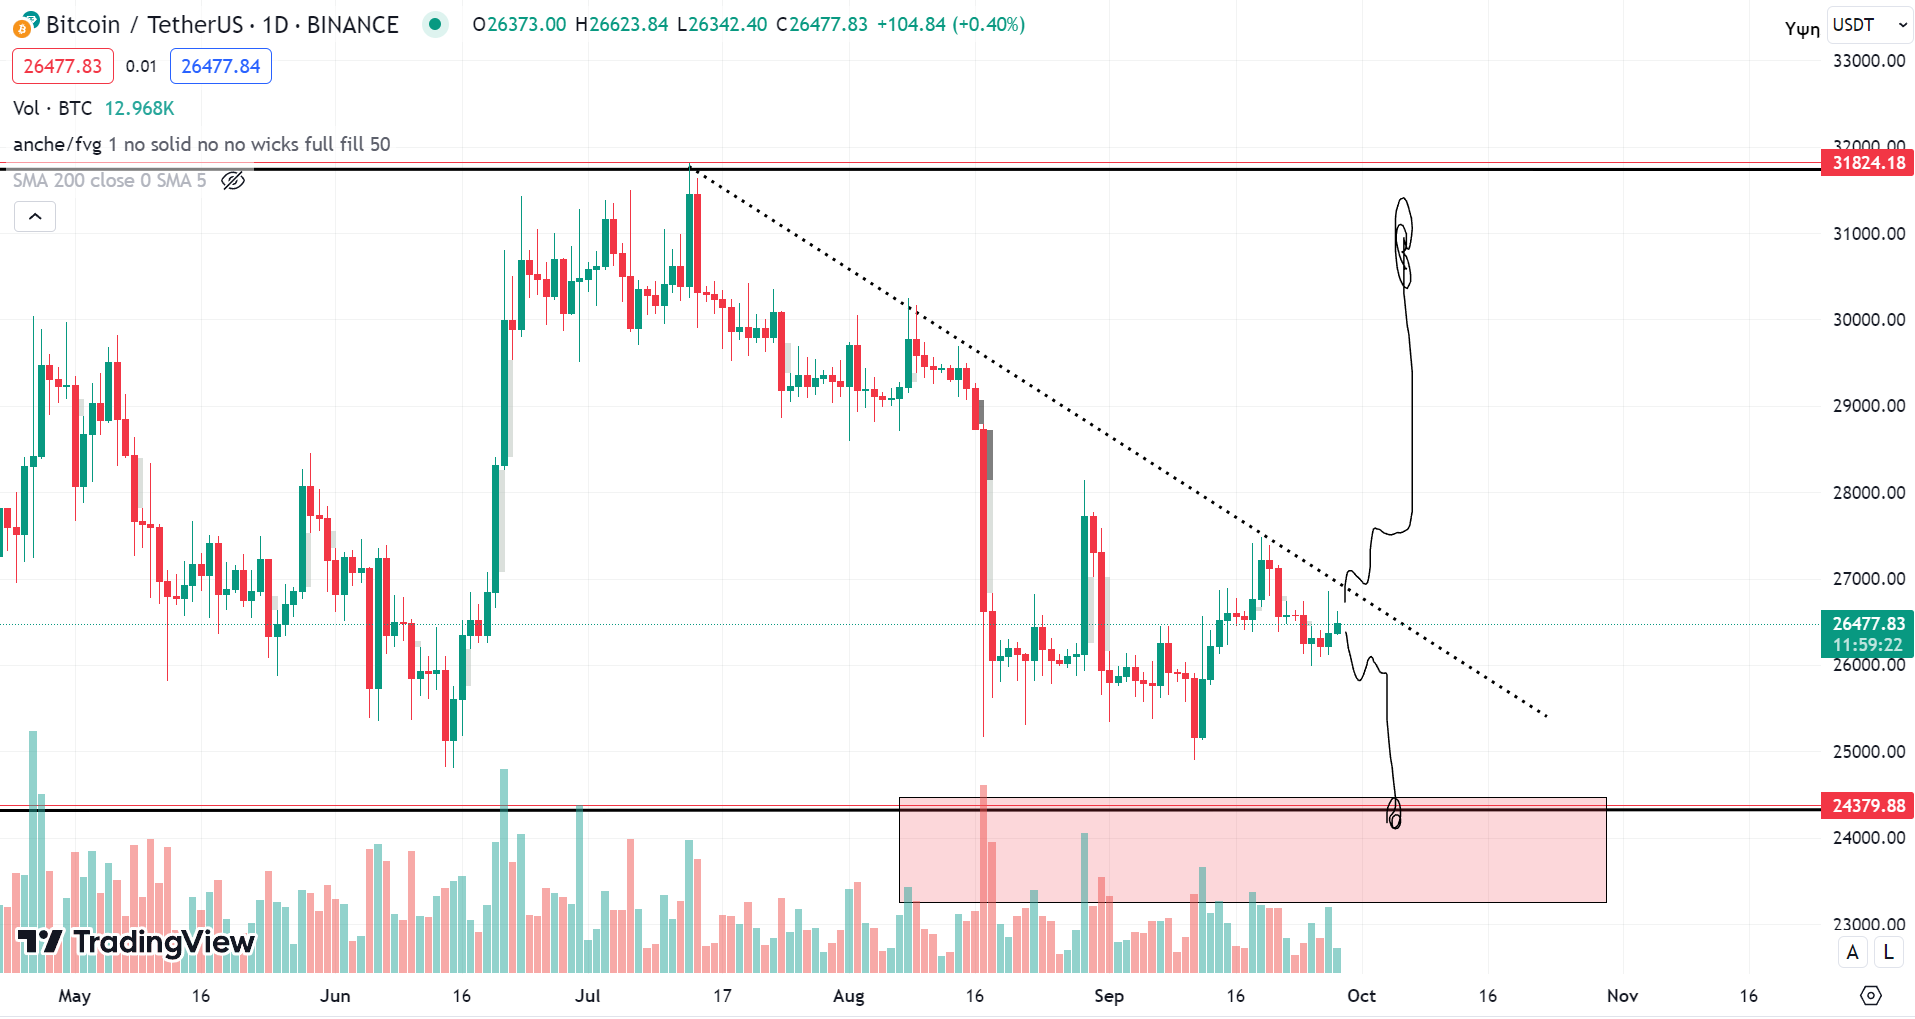
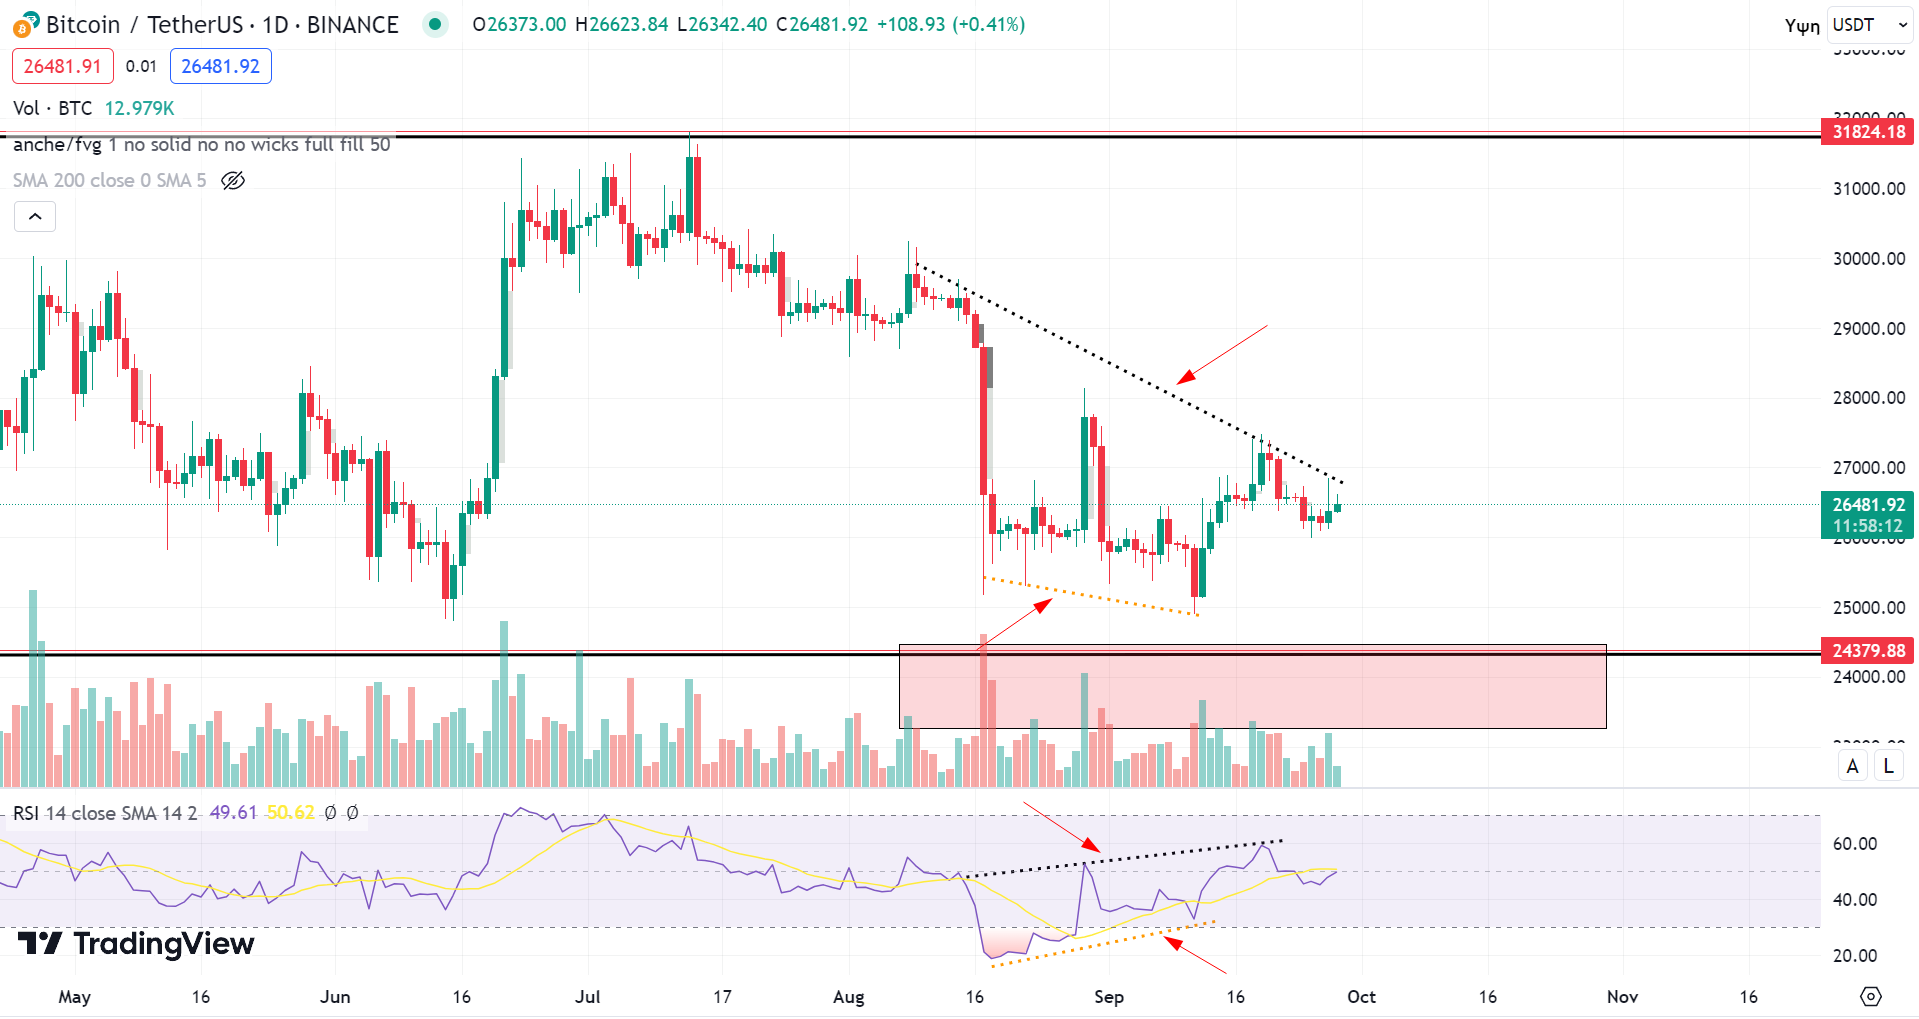
Here we see the daily trendline (dashed black line). This line seems to be pushing the price down, on top of what we said about the monthly moving average at 26.6K and the 200-week moving average at 27.9K. If we manage to break above this line, we can think about a long up to the top of the range. Still, I continue to believe the most likely scenario is a move toward 23K–24K. That’s because, while we had built a bullish divergence on the daily (dashed yellow lines), which was a positive sign for a rise, that positive signal is now being invalidated because we have built a bearish hidden divergence on the RSI indicator (dashed black lines).
That’s it from me. Keep going strong, folks, and be careful! Always use risk management, stop losses and proper position sizing. Happy trading! Thanks a lot!
Find us on our YouTube channel.
For crypto trading courses in Greek, click here.
Or send us a message on our socials and we’ll put you in touch with the crypto academy we work with.
Want to support the channel? Buy the latest Ledger Nano using this link (affiliate link).