Market cap analysis June 26, 2021
A thrilling week in terms of volatility, and an important one from a technical point of view.


June is almost over, dear readers, and today, Saturday, June 26, many are anxiously watching their screens to see where the market goes. The week is coming to an end, and it was a fairly interesting one in the crypto market, with plenty of volatility.
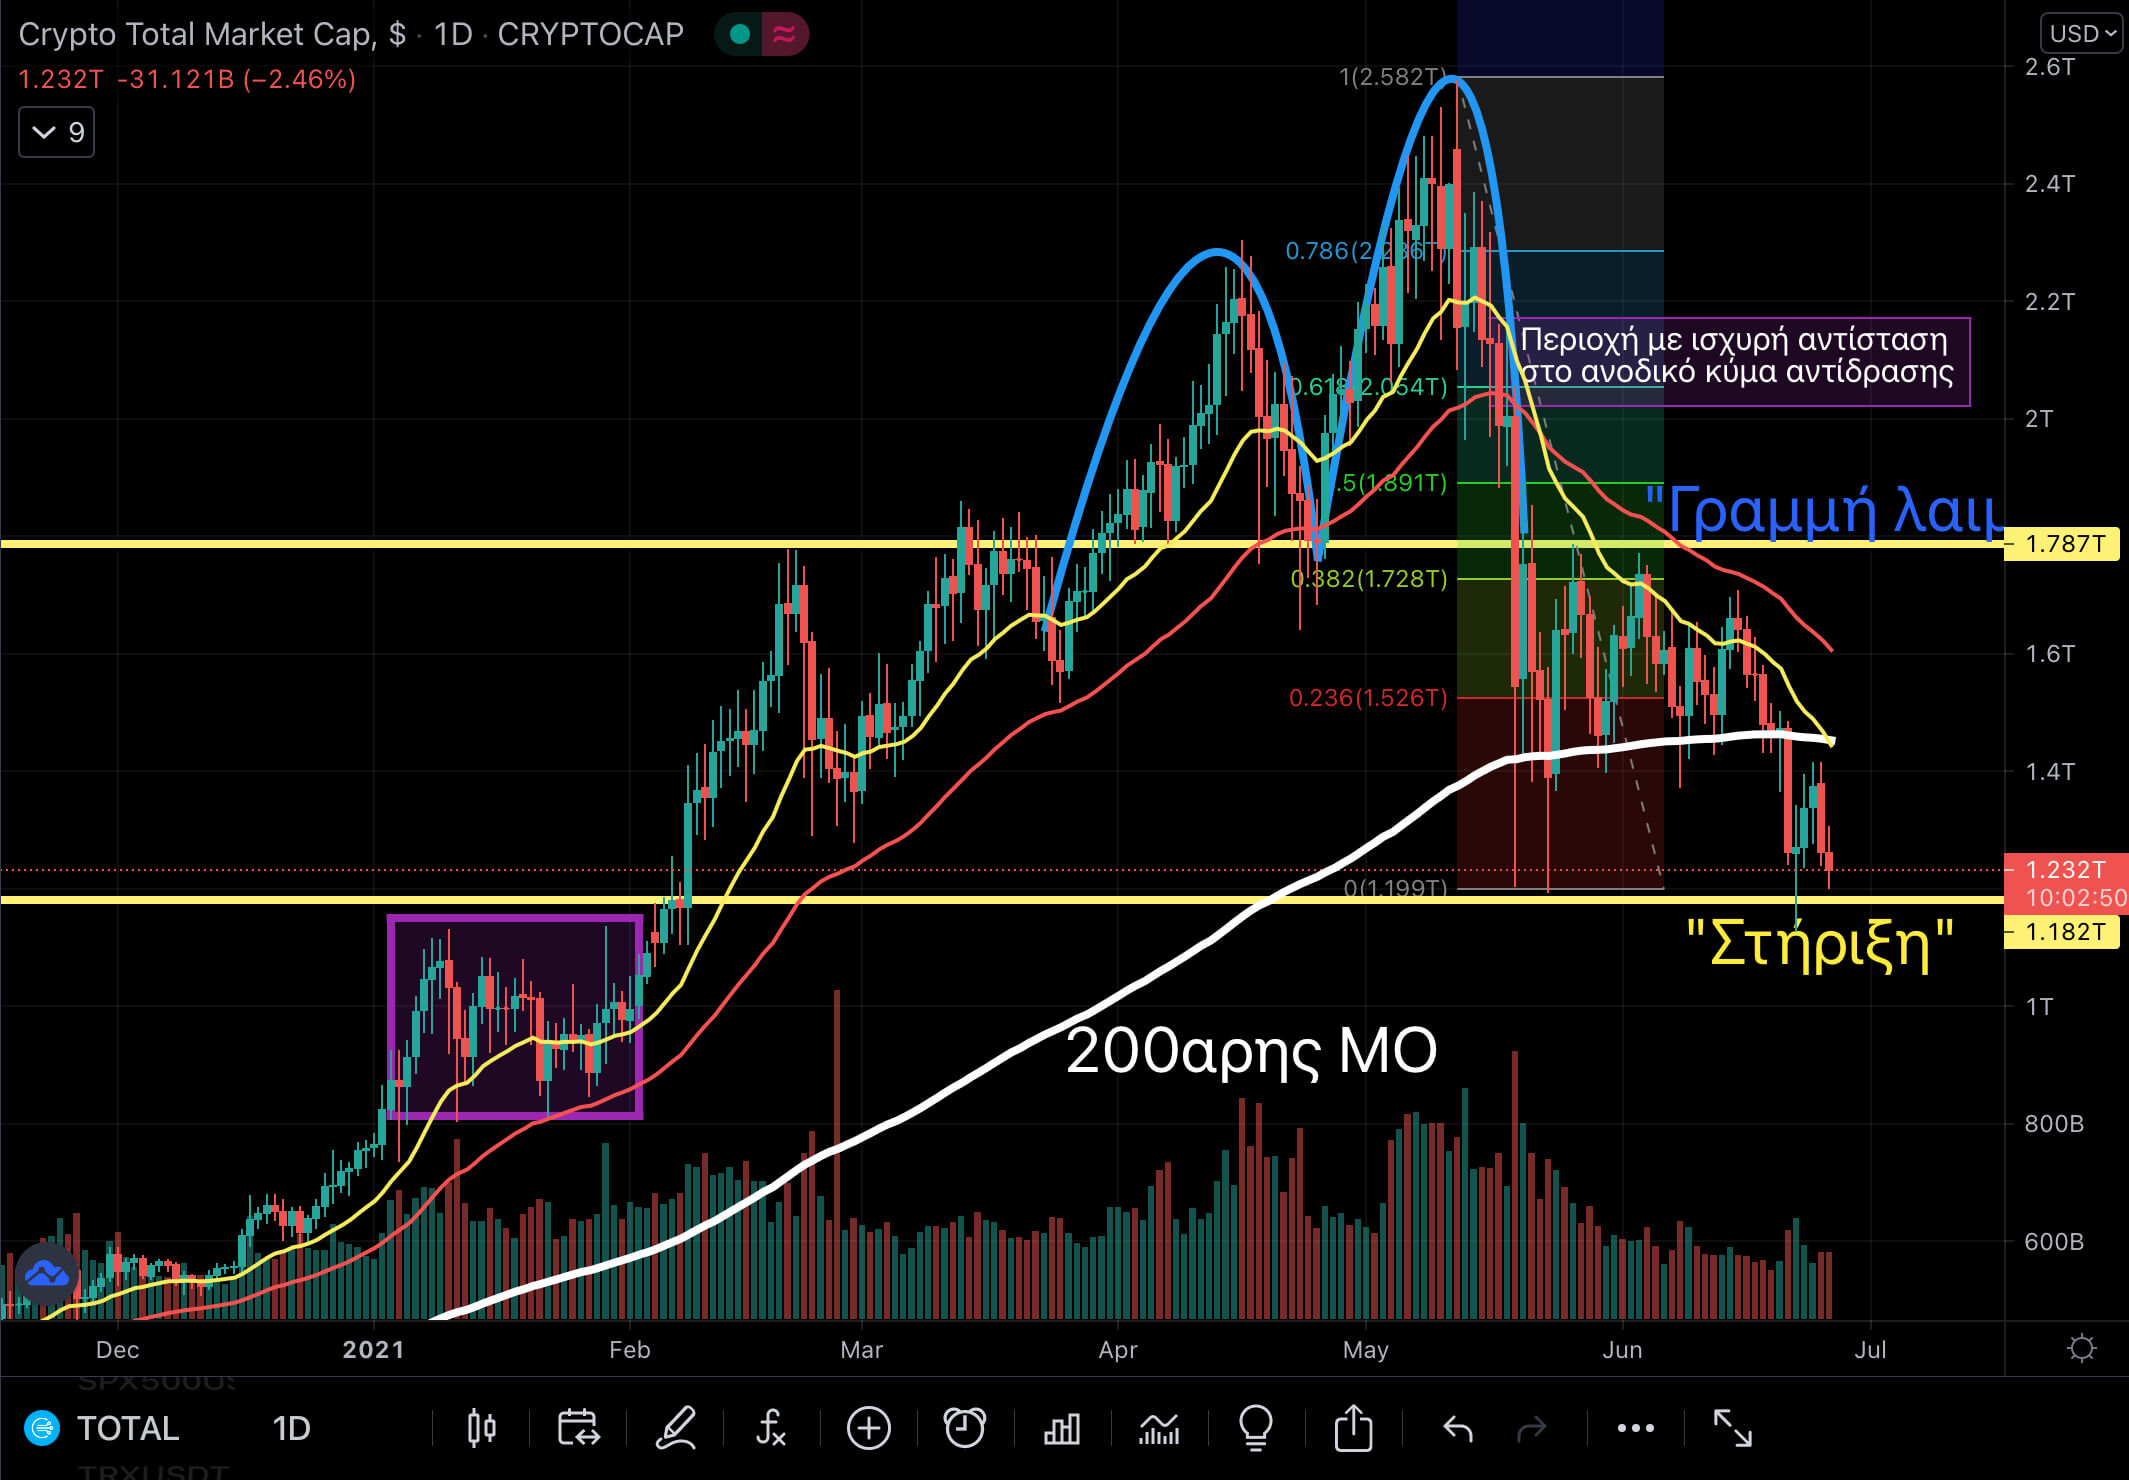
More specifically, the market opened Monday with heavy losses, and the negative sentiment carried over into Tuesday, when the market set new lows: BTC broke the psychological $30,000 barrier and traded as low as $28,600, where it bounced, along with the market as a whole. The rest of the market moved in a similar way, and we will now focus on total market cap, which is the subject of today’s analysis.
Looking at the daily chart, on Monday, June 21, the market “broke” below the 200-day moving average (white line), which during May had acted as a “cushion” against the decline, with buyers making their presence felt on the market’s dips. Now we see the opposite, as the market is below the 200-day MA. For many, this development technically confirms the start of a bear market, and anxiety is rising. After the breakdown, on Tuesday we saw the market bounce and try to move toward the 200-day MA, which now acts as a magnet as prices tend to approach it.
As a reminder, on Friday sellers with short-term speculative targets appeared in this area. It is also worth noting that derivatives expired yesterday, Friday, when big moves are traditionally seen.
Right now, on June 26, total market cap stands at $1.23 trillion, with the market moving lower today. A possible break of the horizontal “support” line could trigger further liquidations across many wallets and a drop in market cap toward the “purple box” on the left of the chart, at around $900 billion, the same level as at the start of 2021.
What we want to point out is that caution is advised, as there are quite a few negative signals, and many investors are following developments as closely and with as much interest as we are.
For the mood to reverse and turn to optimism, the lows and the horizontal support line must not be breached, and we need to see positive sessions with green candles accompanied by higher volume. Those signs would mean there is buying interest and that the bulls are returning to the market.

