Ripple (XRP) July 10, 2021
Technical analysis of Ripple (XRP), July 5–11.


 XRP today
€0.9026
−2.1% in 24h
Price and chart
Dear readers, we are already in the middle of summer, and since you asked for it, here is the technical picture for Ripple.
Since we can’t skip the chart, we include it in this column as a guide to help you.
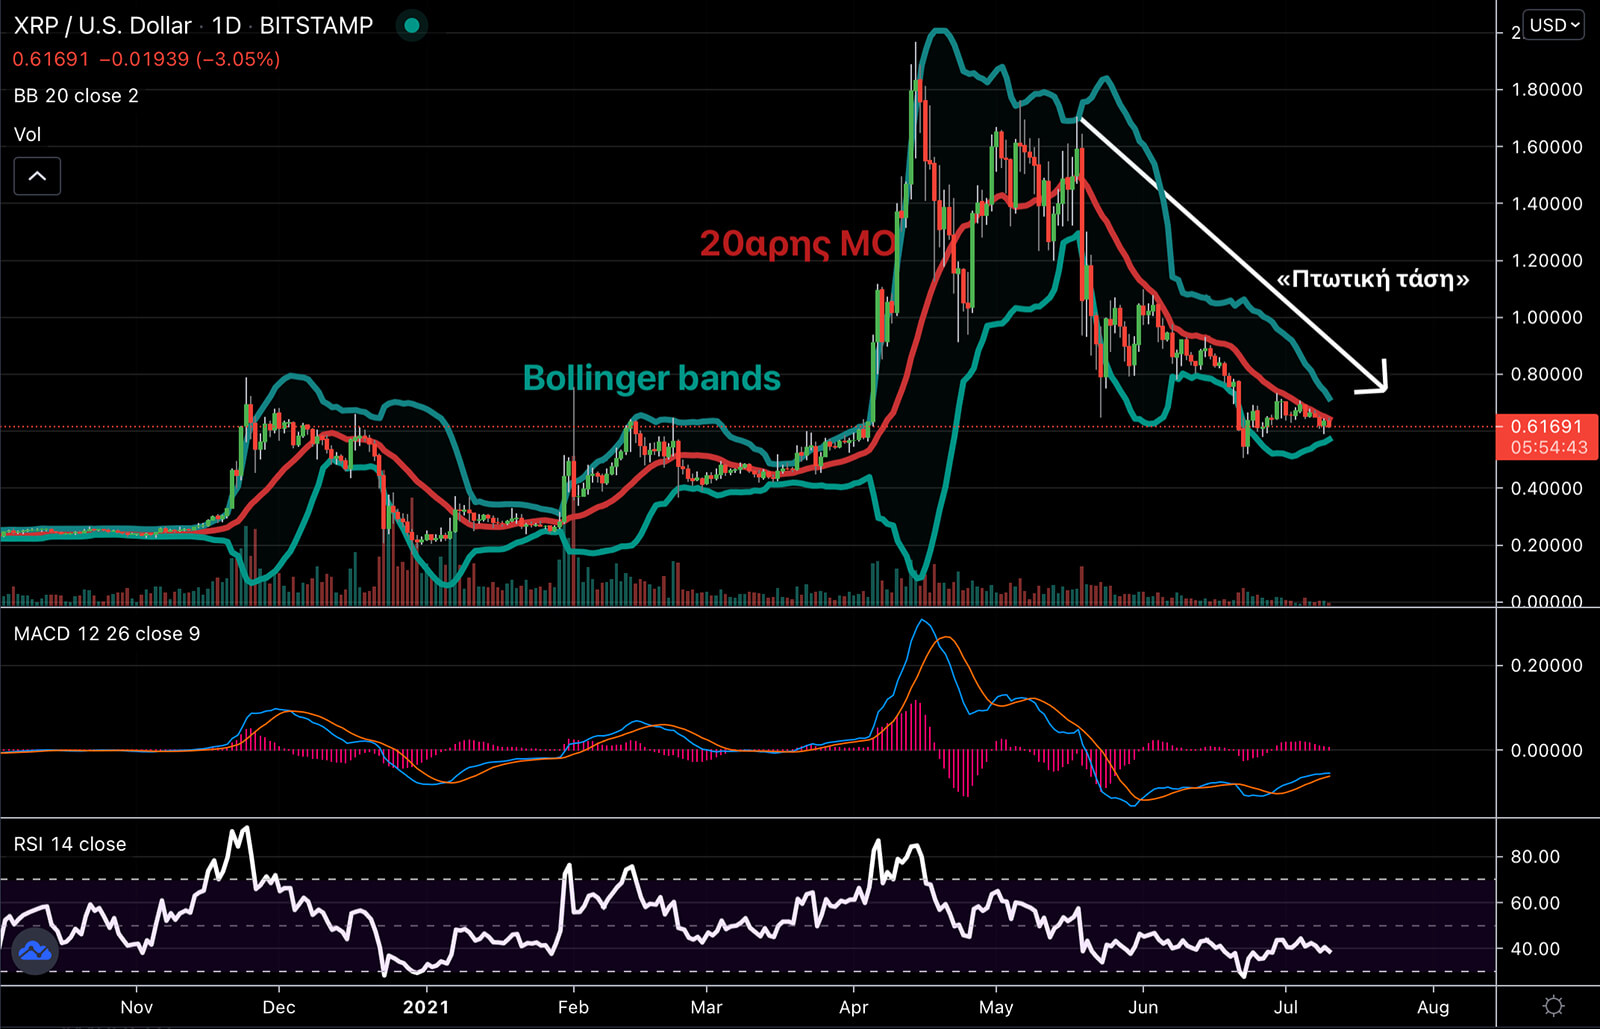
On the chart we have drawn Bollinger Bands (green lines), the 20-day moving average (red line), and the RSI (14-period) and MACD oscillators, the latter with the well-known 26, 12, 9 settings.
The truth is, because we like to call things as they are, based on what the chart tells us we are not at all excited about the “technical picture.” At the same time, we are puzzled by the various opinions and analyst reports about Ripple circulating online.
Put simply, since the March peak the chart has not given a single positive sign. The trend is down, and after the break below the $1.10 area, buyers seem to have no appetite for risk.
More specifically:
- The Bollinger Bands have formed a downward channel.
- The 20-day MA is on a downward path.
- Ripple’s price is also below the 20-day MA and is moving lower, with no significant bullish bounces.
- The RSI and MACD oscillators refuse to give any strong positive signal.
If you consider the storms the Ripple team went through earlier with the SEC, together with the negative market sentiment, these two factors are more than enough to explain the current trend.
Where do we expect Ripple to go, based on the chart?
Given the strong downtrend, we expect prices to fall further. Buyers are nowhere to be seen, and without them it will take a while for the mood to change. More specifically, we expect any attempt to rise to meet resistance at the “upper Bollinger Band” and the downtrend to continue.